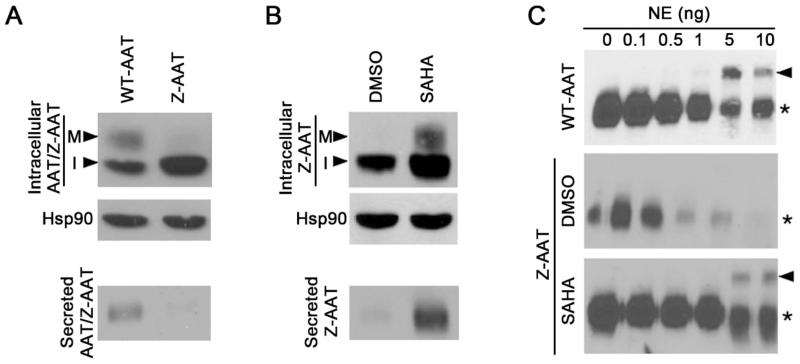
Figure 1.
Western blot shows the secretion and NE inhibition activity of Z-AAT with or without SAHA treatment. (A) Secretion of WT-AAT or Z-AAT. M, mature fraction; I, immature fraction. (B) Secretion of Z-AAT under DMSO or SAHA condition. (C) NE inhibition activity of WT-AAT and Z-AAT with or without SAHA treatment. The band indicated by arrow is the AAT-NE complex. The band labeled by asterisk is the unbounded AAT. This figure is derived from reference (26).

