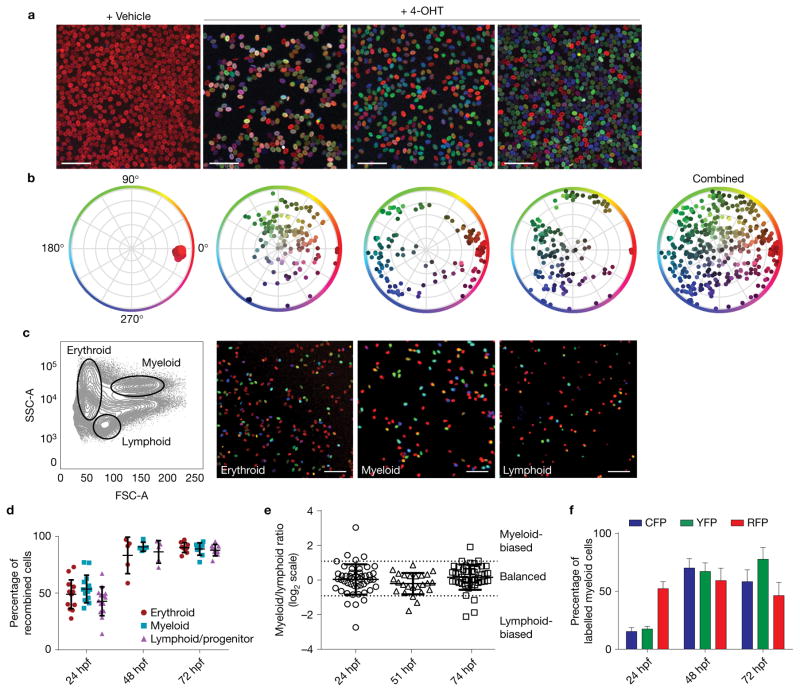
Figure 3.
Label induction in Zebrabow embryos leads to multilineage, polyclonal colour labelling in adult blood and marrow. (a) Tg(ubi:Zebrabow-M;drl:creERT2) embryos were treated with 4-OHT during development and grown to adulthood. Peripheral blood smears were imaged by confocal microscopy and show multicoloured blood in treated fish (scale bar, 50 μm). (b) Multiple, unique colours are evident by measurement of hue and saturation. (c) Mature blood lineages were sorted by fluorescence-activated cell sorting (FACS) and imaged, demonstrating labelling of multipotent HSCs (scale bar, 50 μm). (d) Quantification of labelling efficiency in the mature blood populations at multiple treatment times, measured by flow cytometry (n = 14, 5 and 9 fish for 24, 48 and 72 hpf, respectively). (e) Quantification of lineage contribution at multiple treatment times by flow cytometry. Each marker corresponds to an individual colour clone with the ratio of its myeloid/lymphoid contribution on a log2 scale. Thresholds for lineage bias are defined as ratios below 0.5 or above 2 (mean with s.d., n = 48, 25 and 46 clones for 24, 51 and 74 hpf, respectively). (f) Quantification of fluorophore-positive cells in multiple fish at multiple treatment times. Comparison of CFP+ and YFP+ percentages by two-tailed t-test showed no statistically significant differences at any time (P = 0.594, 0.792 and 0.192 and n = 12, 5 and 10 fish for 24, 48 and 72 hpf, respectively). Error bars show mean and s.e.m. (d,f).

