Figure 6.
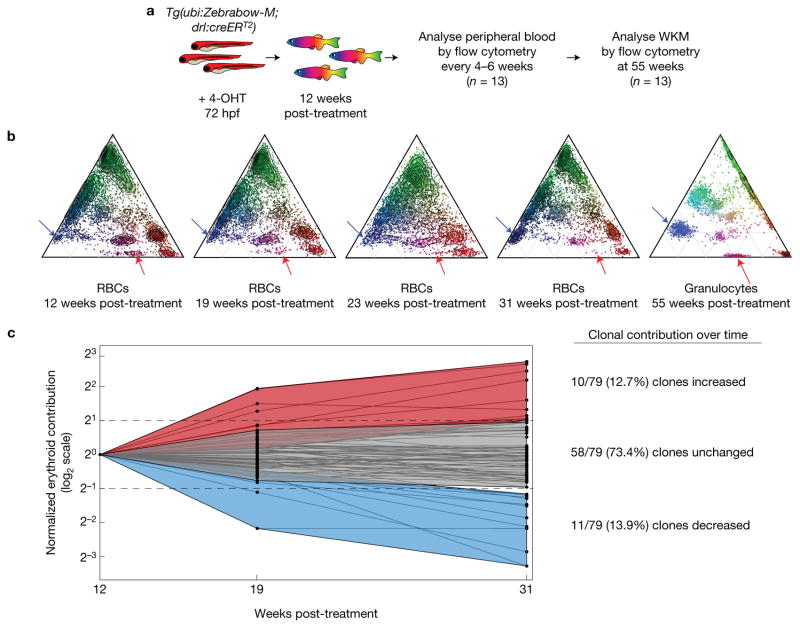
Longitudinal dynamics of labelled erythrocytes. (a) Strategy to evaluate clonal dynamics in the erythroid lineage. (b) Example ternary diagrams that show colour barcode distribution measured by flow cytometry from a single fish over time. The last ternary plot shows colours in granulocytes at a final time (red arrows, clone with decreased contribution over time in erythrocytes (RBCs); blue arrows, clone with increased contribution). (c) Quantification of individual clonal contribution over three analysis times. The contributions of individual colour clones (black dots) were compared across multiple times (log2 scale). Data were normalized to the contribution at the first time. The majority of clones maintain a stable contribution to the blood pool, while a few clones increase (>2-fold) or decrease (>2-fold) in contribution over time relative to the initial time.

