Figure 7.
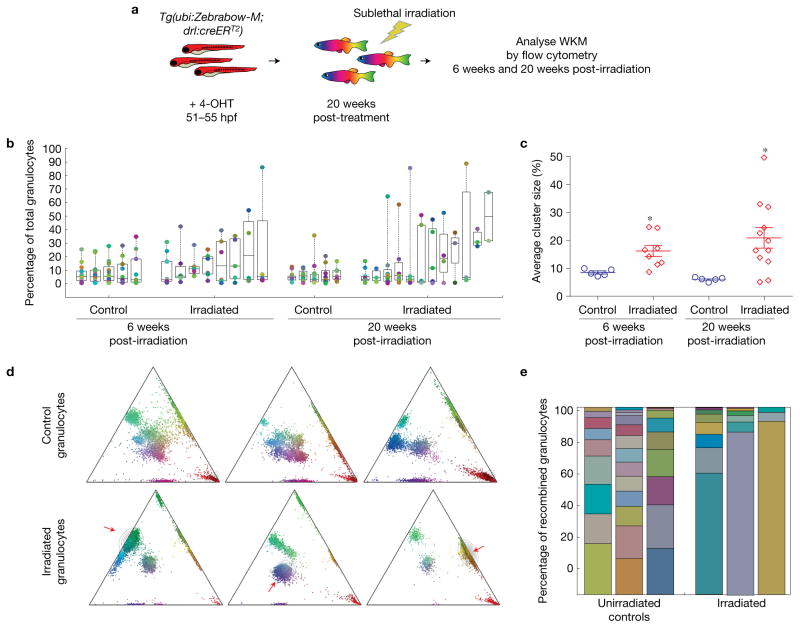
Sublethal irradiation of Zebrabow-labelled marrow. (a) Strategy to measure the effects of sublethal irradiation on clonal diversity in Zebrabow-labelled marrow. (b) Quantification of colour barcodes in mature granulocytes as a percentage of total cells (log2 scale) in control or irradiated animals. Each column of circles corresponds to an individual animal. Box plots show the median and interquartile range (n = 6 and 8 fish for control and irradiated conditions at 6 weeks post irradiation, n = 5 and 12 fish for control and irradiated conditions at 20 weeks post irradiation). (c) Summary of sublethal irradiation data, showing mean cluster sizes in control and irradiated animals (error bars, s.e.m.). Each marker corresponds to an individual animal (n values are identical to those in (b), *P < 0.05, P = 0.017 at 6 weeks, P = 0.021 at 20 weeks, two-tailed t-test). (d) Example ternary plots from control and irradiated adult zebrafish demonstrating severe reduction of clonal diversity. The red arrows indicate an expanded clone. (e) Stacked bar graphs showing the clonal distribution of control and irradiated adult zebrafish.

