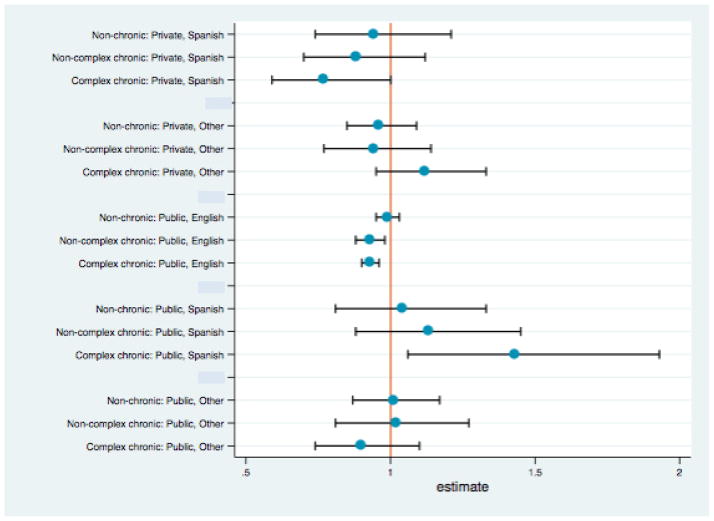
Figure 3.
Adjusted relative ratios for total costs, stratified by complex chronic illness, by language and insurance groups. See Appendix for relative ratio values with 95% confidence intervals and P-values.
Relative ratios are compared to privately-insured English speakers, denoted by the center line. Results are adjusted for length of stay, race/ethnicity, distance from hospital, asthma diagnosis, age category, insurance type, preferred language, and the interaction between insurance and language. Bars represent 95% confidence intervals.

