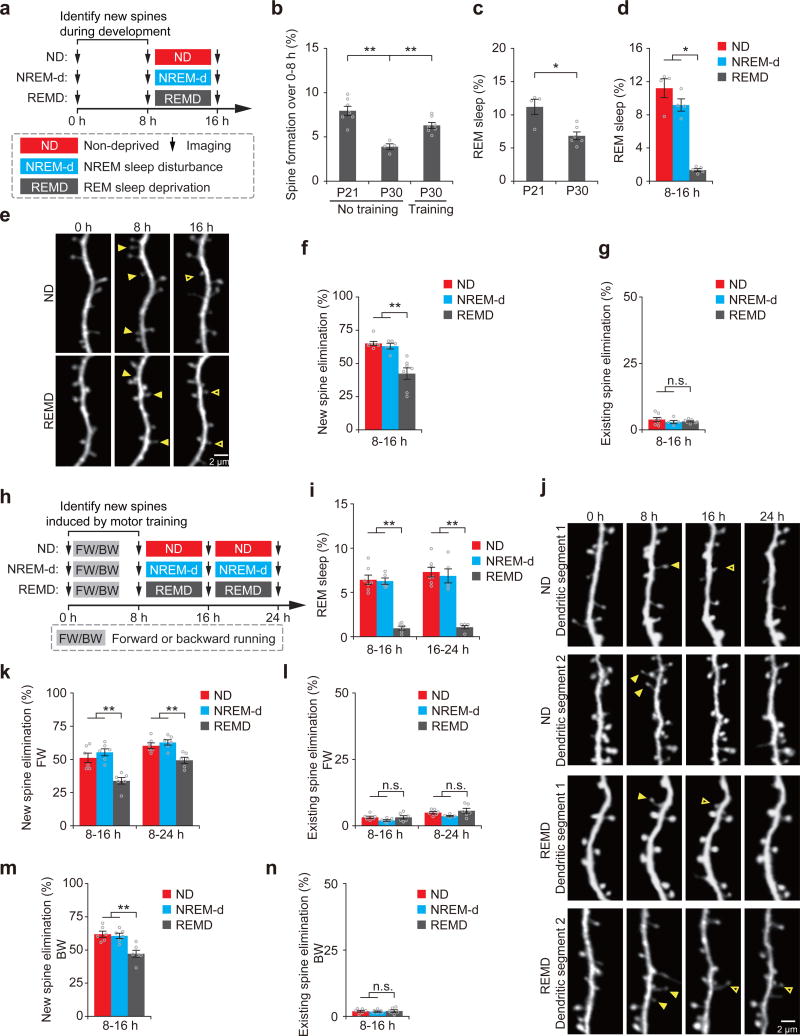
Figure 1. REM sleep prunes newly formed spines during development and after learning.
(a) Schematic of experimental design. After identification of new spines formed between hours 0–8, young mice at P21 were either left undisturbed (nondeprived control, ND), subjected to NREM sleep disturbance (NREM-d) or REM sleep deprivation (REMD) and new spines were imaged over the next 8 h. (b) The rate of new spine formation was significantly reduced as animals matured (P = 0.008; n = 7 and 4 mice at P21 and P30, respectively). Motor training significantly increased the formation of new spines in P30 mice; P = 0.008; n = 7 and 4 mice with and without motor training, respectively). (c) The amount of REM sleep was significantly lower in P30 mice than in P21 mice (P = 0.033, n = 6 P30 mice and 4 P21 mice). (d) The amount of REM sleep was significantly reduced in REMD mice as compared to ND and NREM-d mice between hours 8–16 (ND vs. REMD, P = 0.014; NREM-d vs. REMD, P = 0.014; n = 4, 4 and 5 ND, NREM-d and REMD mice, respectively). (e) Repeated imaging of dendritic spines on apical tuft dendrites of L5 pyramidal neurons in ND and REMD mice at P21. Filled arrowheads indicate new spines formed during hours 0–8. Some new spines (open arrowheads) persisted for the next 8 h. (f) The elimination rate of new spines (formed between hours 0–8) was significantly higher in ND or NREM-d mice than in REMD mice over hours 8–16 (ND vs. REMD, P = 0.002; NREM-d vs. REMD, P = 0.006; n = 7, 5 and 7 ND, NREM-d and REMD mice, respectively). (g) REMD did not affect the elimination of existing spines over hours 8–16 (n = 7, 5 and 7 ND, NREM-d and REMD mice, respectively). (h) Schematic of experimental design. After identification of motor-training-induced (forward running, FW; backward running, BW) new spines formed between hours 0–8, 1-month-old (P30) mice were either left undisturbed (ND), subjected to NREM sleep disturbance (NREM-d) or REM sleep deprivation (REMD) and new spines were imaged over the next 8–16 h. (i) The amount of REM sleep was significantly reduced in REMD mice as compared to ND and NREM-d mice between hours 8–16 (ND vs. REMD, P = 0.003; NREM-d vs. REMD, P = 0.006) and 16–24 (ND vs. REMD, P = 0.003; NREM-d vs. REMD, P = 0.006; n = 7, 5 and 6 ND, NREM-d and REMD mice, respectively). (j) Repeated imaging of dendritic spines before and 24 h after rotarod training in ND and REMD mice. Filled arrowheads indicate new spines formed during hours 0–8 after training. Some new spines (open arrowheads) persisted over the next 8–16 h. (k) The elimination rate of new spines (formed between 0–8 h after FW training) was significantly higher in ND or NREM-d mice than in REMD mice over the next 8–16 h (P = 0.004 for ND or NREM-d versus REMD over hours 8–16; P = 0.008 for ND or NREM-d versus REMD over hours 8–24; n = 6 mice for each group). (l) REMD did not affect the elimination of existing spines between hours 8–24 (over hours 8–16: ND vs. REMD, P = 0.748; NREM-d vs. REMD, P = 0.261; over hours 8–24: ND vs. REMD, P = 0.749; NREM-d vs. REMD, P = 0.078; n = 6 mice for each group). (m) The elimination rate of new spines formed 0–8 h after backward-running (BW) training was significantly higher in ND or NREM-d mice than in REMD mice over the next 8 h (P = 0.006 for ND or NREM-d versus REMD, n = 6 mice for each group). (n) REMD did not affect the elimination rate of existing spines over hours 8–16 (n = 6 mice for each group). Data are presented as mean ± s.e.m. Each point in b–d,f,g,i,k–n represents data from one animal. *P < 0.05, **P < 0.01, n.s. = not significant. Scale bars, 2 μm.

