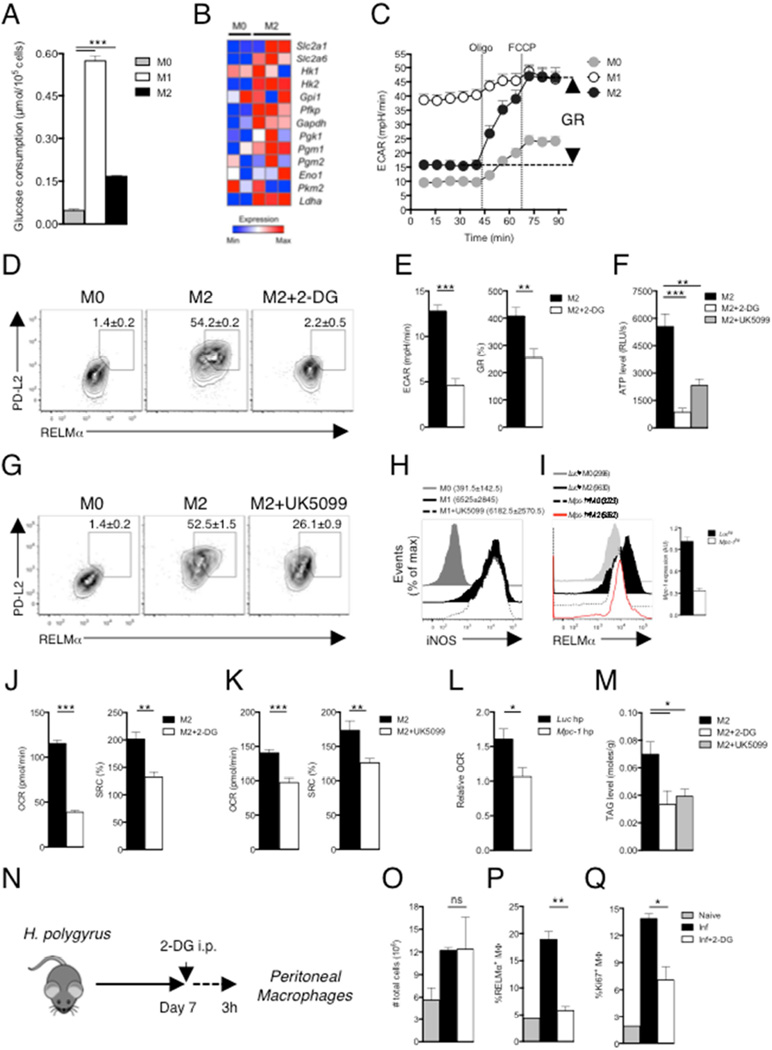
Figure 1. Glucose metabolism is essential for M2 macrophage activation.
(A) Glucose uptake by bone marrow macrophages cultured for 24 hr in medium alone (M0) or with IFNγ plus LPS (M1), or with IL-4 (M2). (B) Relative expression of genes encoding glycolysis pathway enzymes. (C) ECAR at baseline and after sequential treatment with oligomycin (Oligo) and FCCP. GR, glycolytic reserve. (D) PD-L2 and RELMα expression in macrophages cultured for 24 hr in IL-4 with or without 2-DG, and in M0 macrophages. (E) Effect of 2-DG on Basal ECAR and GR in M2 macrophages. (F) Levels of ATP in macrophages cultured for 24 hr without (M0) or with (M2) IL-4 with or without 2-DG or UK5099. (G) PD-L2 and RELMα expression in macrophages cultured for 24 hr in IL-4 with or without UK5099, and in M0 macrophages. (H) iNOS expression by macrophages cultured for 24 hr in M0 or M1-polarizing conditions with or without UK5099. (I) RELMα expression in M2 macrophages transduced with Luc hpRNA or Mpc-1 hpRNA retroviruses. (J–K) Basal OCR and SRC of M2 macrophages with or without 2-DG or UK5099. (L) Relative OCR of Mpc-1 hpRNA transduced M2 macrophages, relative to untransduced M0 macrophages. (M) Levels of TAGs in macrophages cultured for 24 hr with IL-4 with or without 2-DG or UK5099. (N) Plan to assess the role of glucose in M2 macrophage activation during helminth infection. (O) The total number of PEC; (P) the frequency of RELMα+ pMacs, and (Q) the percentage of pMacs expressing the proliferation marker Ki67 (Ki67+MΦ), in mice from experiment shown in (N). PEC from naïve mice (2 per group) were controls. *P < 0.05, **P < 0.005 and ***P < 0.0001 (Student’s t-test). In D–I data are from flow cytometry. In D, G, H and I data from pooled replicates from one experiment are shown. In D, G, numbers are percentages of macrophages that are positive for both markers and in H, I, numbers are mean fluorescence intensity (MFI). Numbers in these panels represent mean ± s.e.m of data from three or more independent experiments. In A, E, F, J–M and O–Q, data are mean ± s.e.m. of technical replicates from one experiment, representative of 3 or more independent experiments. In B data from macrophages harvested from two MO cultures and three M2 cultures are shown.

