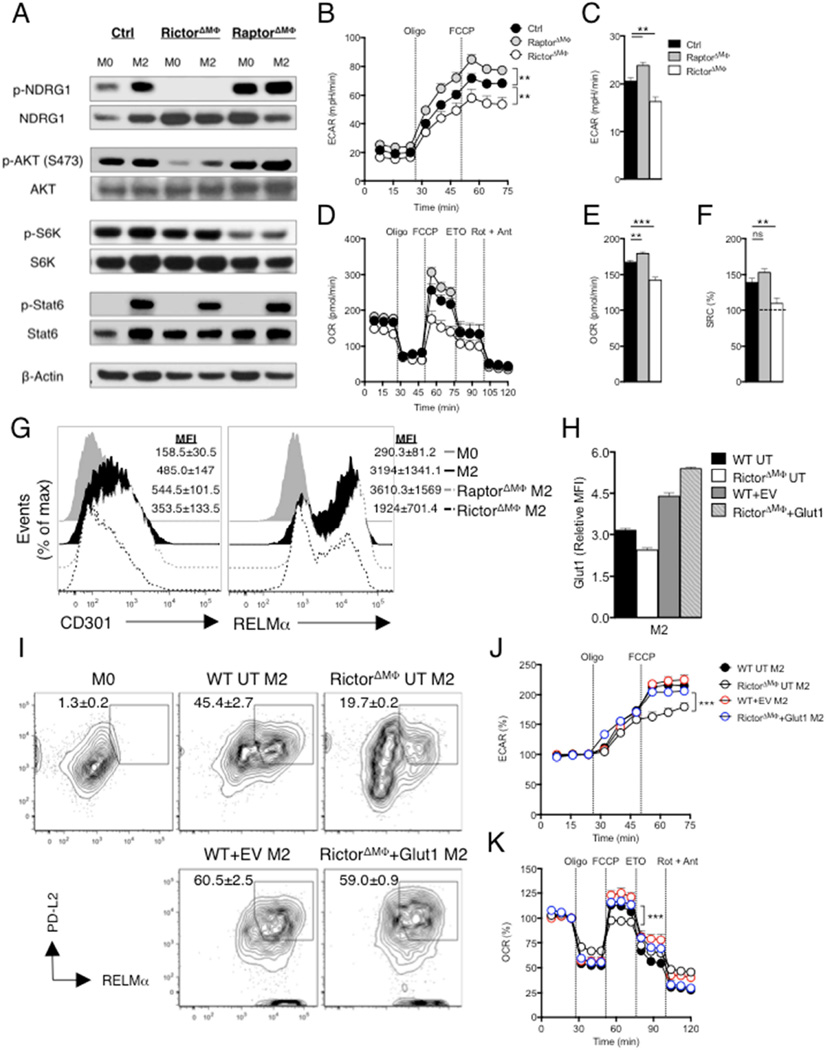
Figure 2. mTORC2 is required to promote metabolic reprogramming and cellular activation in IL-4 stimulated macrophages.
Bone marrow macrophages were from WT (Ctrl), RictorΔMΦ and RaptorΔMΦ mice. (A) Activity of mTORC1 and mTORC2 was assessed by immunoblot analysis for the indicated phosphoproteins from M0 macrophages, or macrophages stimulated for 3 hr with IL-4 (M2). (B) ECAR of M2 macrophages at baseline and following sequential treatment with oligomycin and FCCP. (C) Basal ECAR of M2 macrophages. (D) OCR of M2 macrophages at baseline and following sequential treatment with oligomycin, FCCP, etomoxir (ETO) and rotenone + antimycin. (E–F) Basal OCR and SRC of M2 macrophages. (G) Expression of CD301 and RELMα in M2 macrophages, assessed by flow cytometry. MFI: mean fluorescence intensity. (H–K) WT or RictorΔMΦ macrophages were either untransduced (UT) or transduced with retrovirus encoding a control reporter gene (EV-Ctrl)) or a reporter gene plus the Slc2a1 sequence (encodes Glut1), and stimulated with IL-4. Glut1 expression (H), and expression of PD-L2 and RELMα (I) were measured by flow cytometry. M0 WT macrophages were included in as a control in (I). ECAR (J) and OCR (K) were measured sequentially before and following the addition of inhibitors as indicated. In B-F, H, J and K, data are mean ± s.e.m. of technical replicates from one experiment representative of two or more independent experiments. Data in A, G and I are from pooled replicates from one experiment representative of two or more independent experiments. Numbers in G and I are mean MFI ± s.e.m (G) or mean % ± s.e.m, of date from two or more experiments. **P < 0.005 and ***P < 0.0001.

