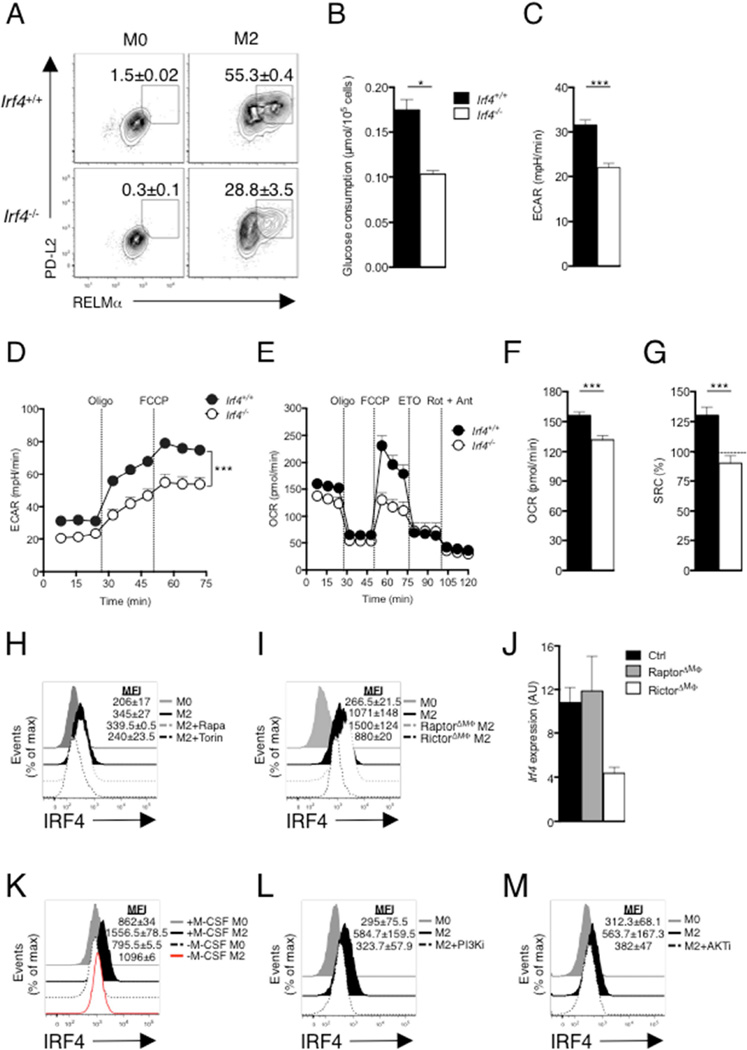
Figure 5. IRF4 mediates glucose metabolism to promote M2 activation.
Bone marrow macrophages were from WT (Irf4+/+) and Irf4−/− mice. (A) Expression of PD-L2 and RELMα in macrophages cultured for 24 hr without (M0) or with (M2) IL-4. (B) Glucose uptake and (C) basal ECAR after macrophage culture in IL-4 for 24 hr. (D) ECAR of macrophages cultured for 24 hr in IL-4, followed by sequential treatment with oligomycin and FCCP. (E) OCR of macrophages cultured for 24 hr in IL-4, followed by sequential treatment with oligomycin, FCCP, etomoxir and rotenone + antimycin. (F) OCR and (G) SRC of macrophages after culture in IL-4 for 24 hr. (H) IRF4 expression by macrophages after culture without or with IL-4 for 24 hr plus or minus rapamycin (Rapa; 20 nM) or Torin 1 (Torin; 100 nM). (I) IRF4 expression by Raptor or Rictor deficient macrophages after culture without or with IL-4 for 24 hr. (J) Expression of Irf4 in IL-4 stimulated WT macrophages, or macrophages lacking Raptor or Rictor, as measured by qRT-PCR (expression normalized to WT M0 macrophages and presented in arbitrary units, AU). (K–M) IRF4 expression by macrophages after culture without (M0) or with (M2) IL-4 or M-CSF (K), PI3Ki (L) or AKTi (M) for 24 hr. Data in A, H, I, K–M are from flow cytometry and are from individual experiments, but numbers represent mean % (A) or MFI, ± s.e.m., of data from 3 or more independent experiments. In B–G, data are mean ± s.e.m. values from technical replicates from one experiment, representative of three or more independent experiments). *P < 0.05, **P < 0.005 and ***P < 0.0001.

