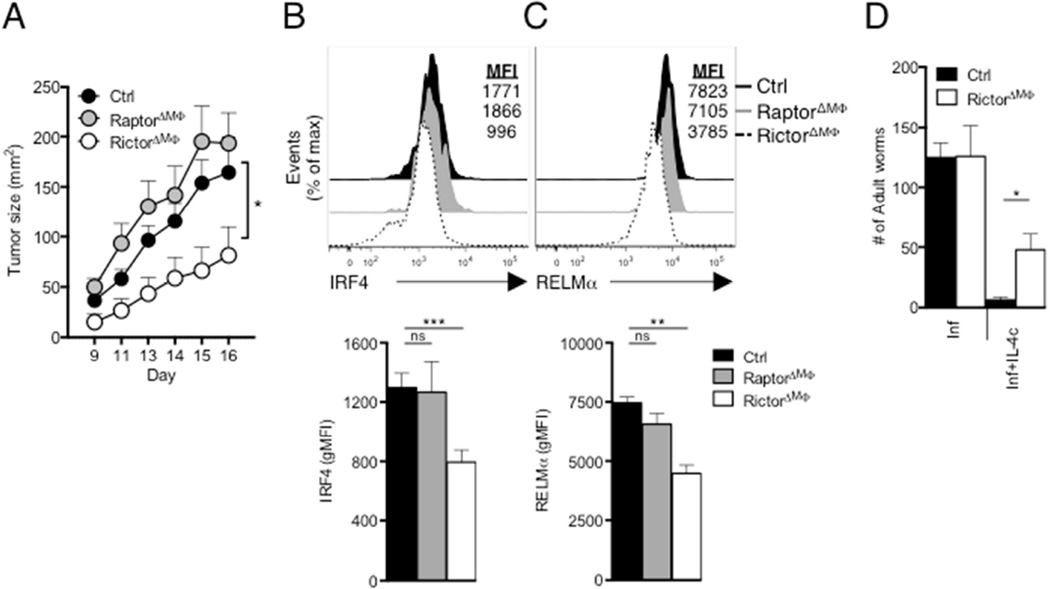
Figure 6. Loss of mTORC2 activity in macrophages suppresses tumorigenesis and inhibits protective immunity against H. polygyrus.
(A) Growth profile of tumors following inoculation of 2×10⁵ B16-OVA melanoma cells into WT (Ctrl), RaptorΔMΦ or RictorΔMΦ mice. (B) Top, IRF4 expression by TAMS from day 16 tumors from from Ctrl, RaptorΔMΦ and RictorΔMΦ. Bottom, geometric MFI of IRF4 staining shown in top panel. (C) Top, RELMα expression by TAMs, as in (B). Bottom, gMFI of RELMα. staining shown in top panel. (D) Adult H. polygyrus counts from infected WT (Ctrl) and RictorΔMΦ mice which on days 9, 11, 13 and 15 after infection were injected with PBS (Inf) or IL-4c (Inf+IL-4c), followed by analysis on day 16. Data are mean ± s.e.m. of five to six individually analyzed mice/group in one experiment, and representative of two independent experiments (A–C), or from one experiment representative of two independent experiments (mean ± s.e.m. of three to five mice per group) (D). *P < 0.05, **P < 0.005 and ***P < 0.0001.

