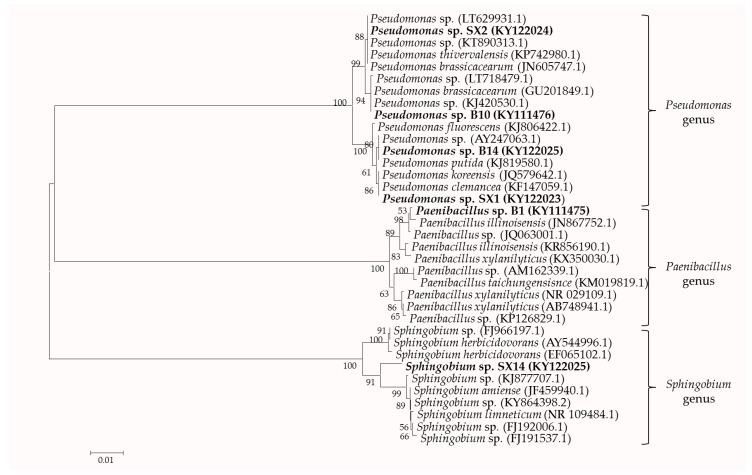
Figure 2.
Phylogenetic tree based on 16S rRNA sequence shows the position of isolated strains with other closely related strains. These 16S rRNA sequences of related strains were downloaded from NCBI GenBank database. The tree was structured using neighbor joining method, with the bootstrap analyses of 1000 cycles. Only bootstrap values greater than 50% is shown at the branching points. Bar represents sequence divergence of 0.01 nucleotides. Strains isolated in this study are underlined with the bold letters.

