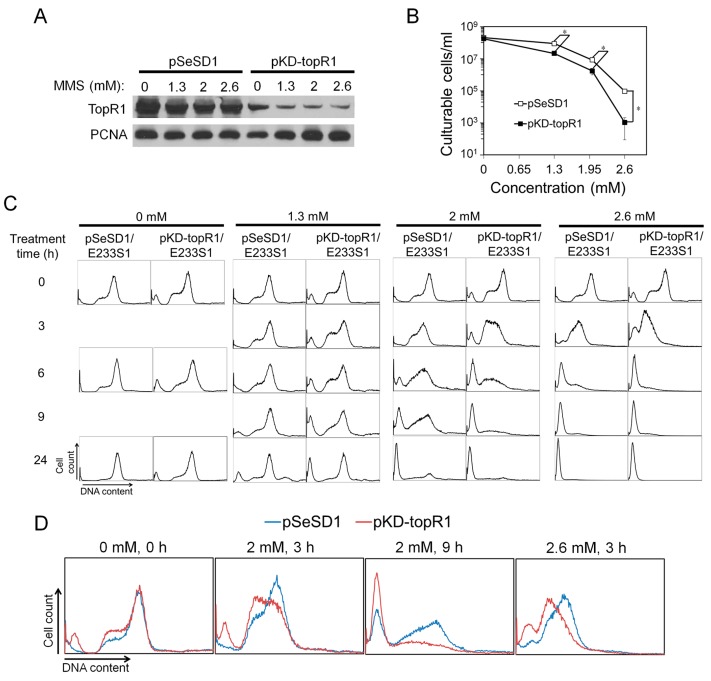
Figure 5.
Knockdown of TopR1 accelerated MMS-induced genomic DNA degradation. Reference strain (pSeSD1/E233S1) and the TopR1 knockdown strain (pKD-topR1/E233S1) were treated with 0, 1.3, 2 or 2.6 mM MMS. After 3 h, cellular samples were taken for Western blot analysis of TopR1 and PCNA3 levels (A) and cell viability (B); (C) flow cytometry analysis of DNA content distribution of pSeSD1/E233S1 and pKD-topR1/E233S1 cultures during MMS treatment. Sampling time points are indicated; (D) comparison of cellular DNA content of pSeSD1/E233S1 (blue line) and pKD-topR1/E233S1 (red line) during MMS treatment. The MMS concentration and treatment time are indicated. The asterisk represents p values less than 0.05. The p value was calculated by paired t test. The data are representatives of three biological repeats.

