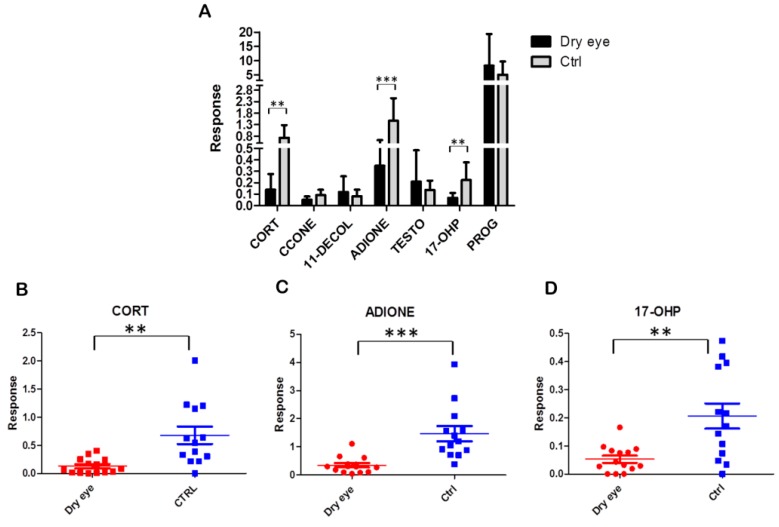
Figure 2.
(A) Tear steroid profiling of dry eye (n = 14) and of healthy control patients (n = 13). Data are mean values and bars represent the corresponding standard deviations (SD); (B–D) Tear sample distribution for the significantly different steroids: CORT, ADIONE and 17-OHP response levels, respectively. ** indicates p < 0.01 and *** indicates p < 0.001.

