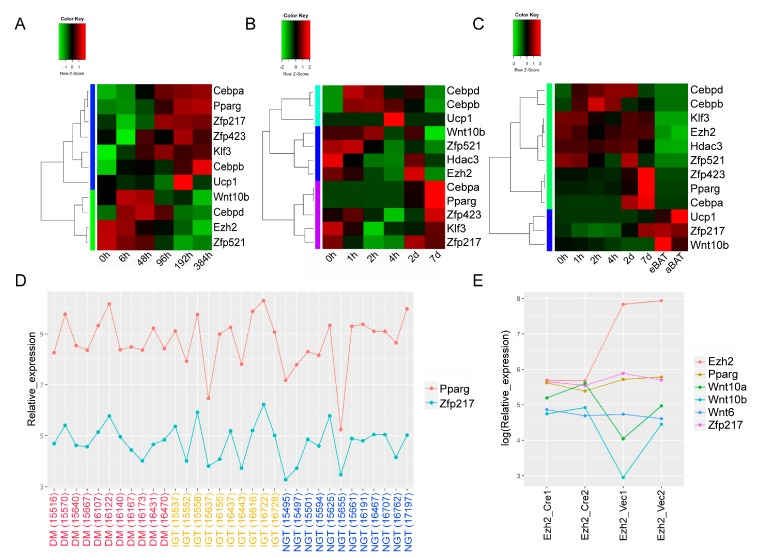
Figure 1.
Zfp217 is implicated in adipogenesis based on Gene Expression Omnibus (GEO) datasets. (A) The heatmap of expression profiling of Zfp217 and marker genes in GSE76131. The resulting transcriptomic data-set includes six induction differentiation time points (0, 6, 48, 96, 192 and 384 h) in human simpson-golabi-behmel syndrome (SBGS) pre-adipocyte cells; (B,C) The heatmap of expression profiling of Zfp217 and marker genes in GSE87113. Expression profiling by RNA-seq during adipogenesis (0, 1, 2, 4 h, 2 and 7 days) in 3T3-L1 (B) and brown preadipocytes (C) in culture as indicated in the x axis, eBAT: embryo_BAT; aBAT: adult_BAT; (D) The line chart of expression profiling of Zfp217 and Pparg in diabetes mellitus (DM, the red group as indicated in the x axis), impaired glucose tolerance (IGT, the yellow group as indicated in the x axis) and normal glucose tolerance (NGT, the blue group as indicated in the x axis) adipose tissue samples. Data were obtained from GSE27951; and (E) The line chart of expression profiling of Zfp217 and marker genes in GSE20054. Expression profiling by Ezh2-flox/flox preadipocytes infected with retroviruses expressing Cre or vector alone.

