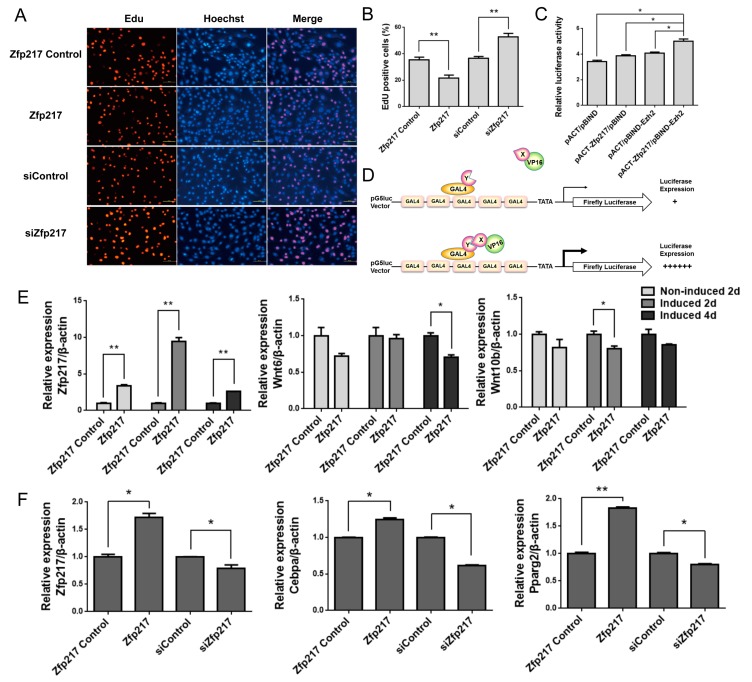
Figure 4.
Zfp217 suppresses cell proliferation and interacts with Ezh2, which represses Wnt signaling genes, to facilitate adipogenesis. (A) DNA synthesis of C3H10T1/2 cells was measured by 5-ethynyl-2′-deoxyuridine (EdU) incorporation assay after the indicated transfection. The EdU staining (red dots) represents the population of newborn cells. Hoechst 33342 staining (blue dots) was used to label cell nuclei. Scale bar indicates 100 μm; (B) EdU incorporation quantitative analysis. Five microscopic fields were randomly selected. EdU positive cells (%) were quantified by Image J, which was calculated by the formula: EdU positive cell (100%) = red dots/(red dots + blue dots) × 100%. All data were obtained from three reproducible experiments; (C) In the mammalian two-hybrid system, the Zfp217-Ezh2 interaction is confirmed by significantly higher luciferase activity in cells transfected with pACT-Zfp217 and pBIND-Ezh2, compared to cells transfected with one expression vector and one empty vector or two empty vectors. Results were displayed as firefly luciferase activity normalized to renilla luciferase activity and represented as means ± SEM (n = 4); (D) Schematic representation of the Mammalian Two-Hybrid System. The pG5luc Vector contains five GAL4 binding sites upstream of a minimal TATA box, which in turn is upstream of the firefly luciferase gene. The interaction between the two test proteins, expressed as GAL4-X and VP16-Y fusion constructs. An interaction between proteins X and Y brings the VP16 and GAL4 domains into close proximity, and results in an increase in luciferase expression over the negative controls; (E) The mRNA levels of Wnt6 and Wnt10b at non-induction, two days and four days post-adipogenic induction after treatment with pcDNA3.1-Zfp217 or empty pcDNA3.1 vector (n = 3); and (F) The mRNA levels of Cebpa and Pparg2 at four days post-adipogenic induction after treatment with pcDNA3.1-Zfp217 or empty pcDNA3.1 vector/Zfp217 siRNA or siRNA control (n = 3). Reverse transcriptase-quantitative polymerase chain reaction (qRT-PCR) data were standardized with β-actin and represented as means ± SEM. * p < 0.05, ** p < 0.01 versus control.

