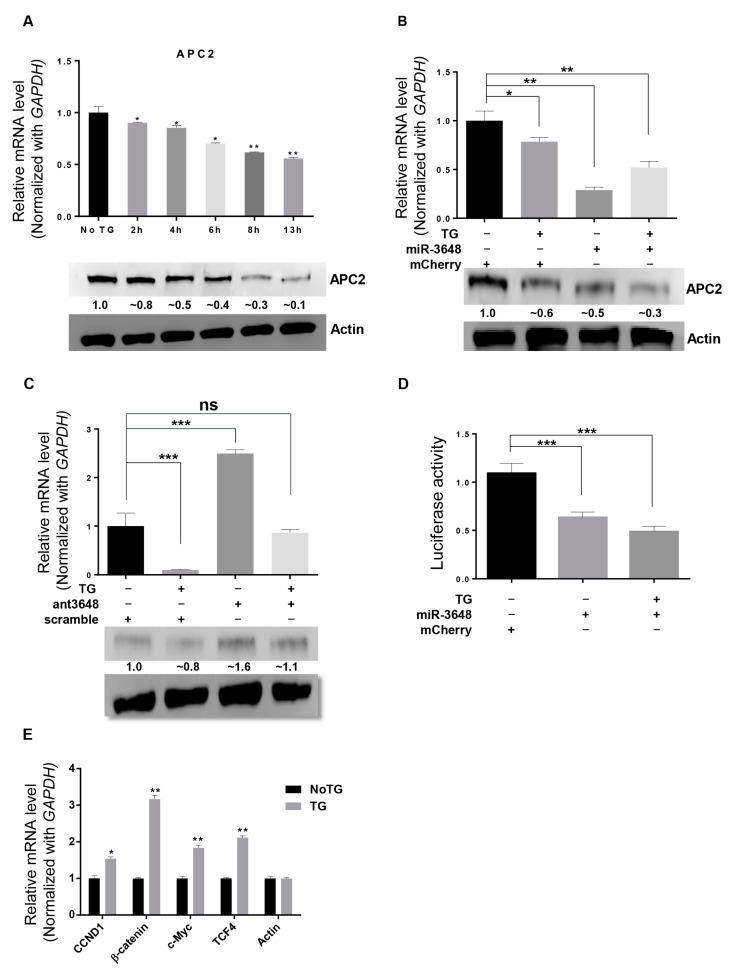
Figure 4.
APC2 was regulated by miR-3648 under ER stress: (A) APC2 mRNA levels (qRT-PCR) and protein levels (Western blots) in HEK293T cells after TG treatment at different time intervals; (B) APC2 mRNA levels (qRT-PCR) and protein levels (Western blots) in HEK293T cells with or without TG treatment and miR-3648 overexpression. Although the levels of APC2 mRNA seems to increase when miR-3648 was overexpressed in stressed cells, the change was statistically not significant (p = 0.09). Protein bands were quantified with Image J; (C) APC2 mRNA levels (qRT-PCR) and protein levels (Western blots) in HEK293T cells with or without TG treatment and miR-3648 antagomir (ant3648). Protein bands were quantified with Image J; (D) APC2 3′ UTR Luciferase assays in HEK293T cells with or without TG treatment and miR-3648 overexpression. (E) qRT-PCR analyses of Wnt/β-catenin pathway genes in ER stressed HEK293T cells. * p < 0.05; ** p < 0.01; *** p < 0.001. p values were determined with two-tailed student’s t test. All data were from three repeats. Errors bars represent S.D.

