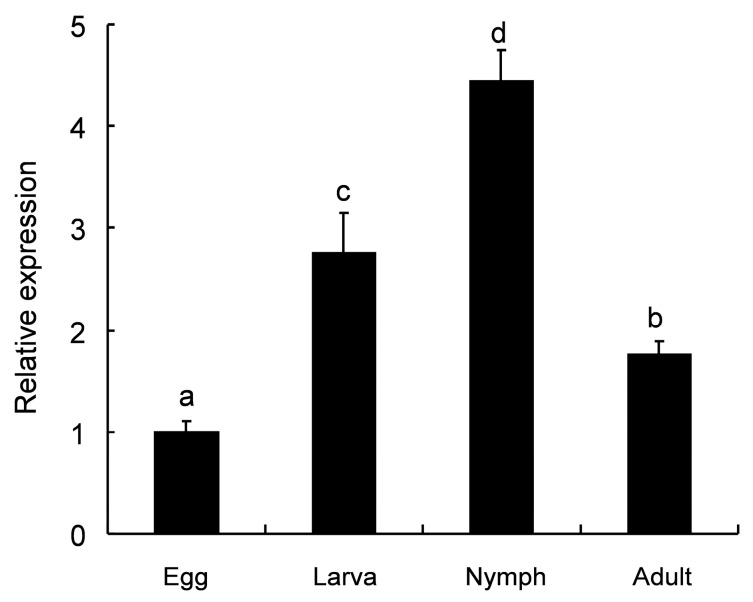
Figure 4.
Expression levels of the plasma membrane Ca2+-ATPase 1 gene (TcPMCA1) at different developmental stages of Tetranychus cinnabarinus were evaluated using Real-time Quantitative polymerase chain reaction (RT-qPCR). The egg, larval, nymphal, and adult stages were analyzed. Relative expression was calculated according to the value of the lowest expression level, which was assigned with an arbitrary value of 1. Letters above the bars indicate significant differences among different developmental stages. RPS18 was used as reference gene. Data were presented as the means (±SE) of three biological replications per developmental stage. Different letters on the error bars indicate significant differences revealed by ANOVA test (p < 0.05).

