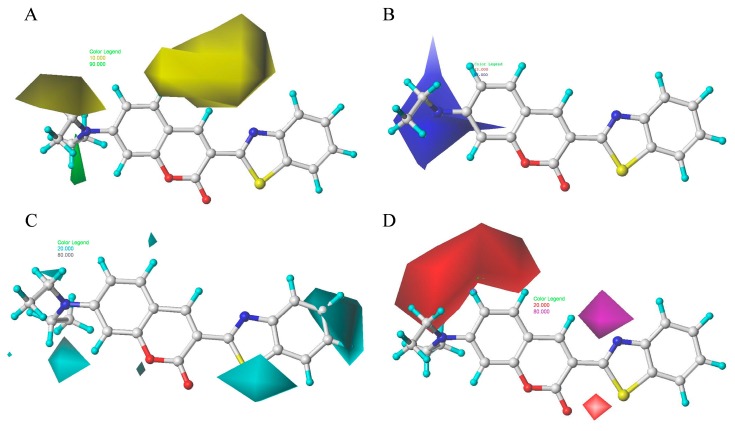
Figure 12.
Steric (A), electrostatic (B), hydrophobic (C), and H-bond (D) contour maps obtained using CoMSIA-derived models based on molecule 2. Green (A) indicates regions where the introduction of a bulky group would increase activity. Yellow (A) indicates regions where the introduction of a bulky group would decrease activity. Blue (B) indicates regions where the introduction of electropositive groups is favored. Cyan (C) indicates regions where the introduction of hydrophobic is favored. Purple (D) indicates regions where the introduction of H-bond acceptors is favored. Red (D) indicates regions where the introduction of H-bond acceptors is disfavored. The others in Figure A–D represent the compound 2 (Red, oxygen atoms; yellow and blue, nitrogen atom; cyan, hydrogen atom; gray, carbon atoms).

