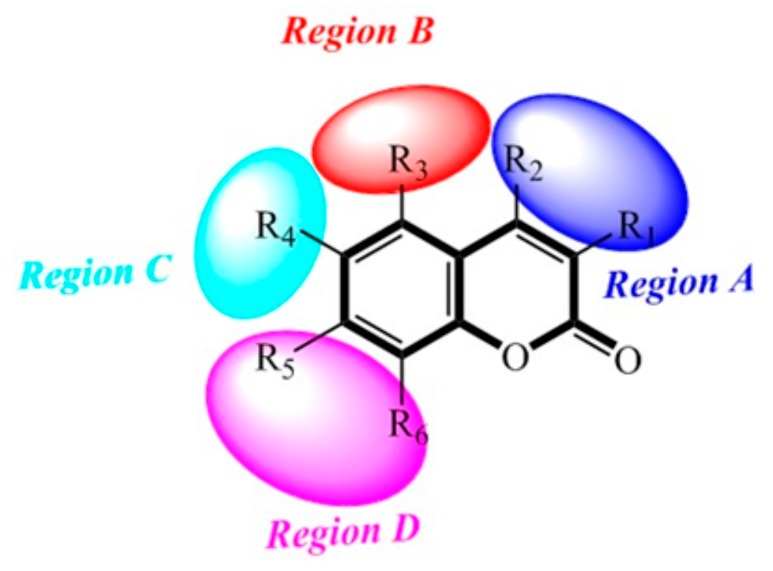
Figure 13.
Diagram of structure–activity relationship based on the core structure of the tested compounds. Blue (region A) indicates regions where the introduction of electropositive group, hydrophobic group, or H-accepting groups would increase activity. Red (region B) indicates regions where the introduction of hydrophobic group is favored. Cyan (region C) indicates regions where the introduction of electronegative group is favored. Magenta (region D) indicates regions where the introduction of a bulky group, hydrophobic group, or electropositive group would increase the activity. Dark indicates the core structure of the test compounds.

