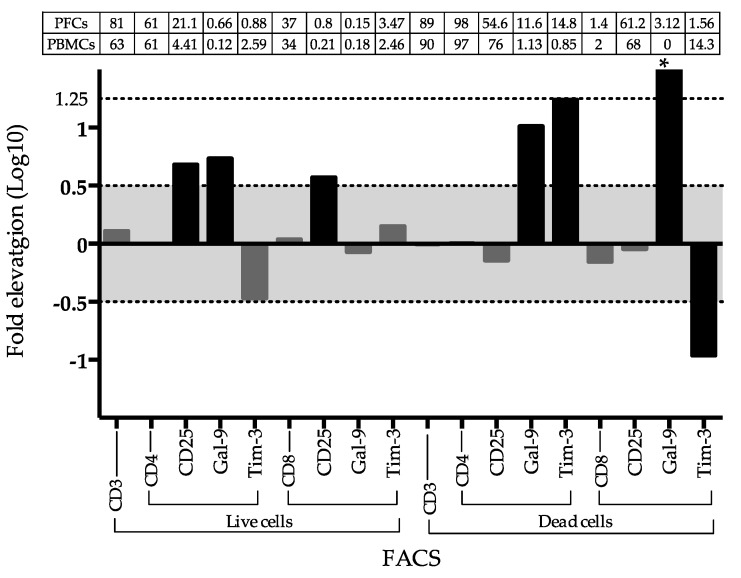
Figure 4.
Fluorescence-activated cell sorting (FACS) analysis between PBMCs and PFCs. Fold comparison for the frequency of cells of interest in FACS analysis between PBMCs and FBCs. * indicates infinite as Gal-9 positive expression percentage in dead CD8 T cells from PFCs and PBMCs are 3.12 and 0, respectively. Gates of selection were indicated under x-axis. The absolute percentage of each gated cell group was described in the table above the indicated panel.

