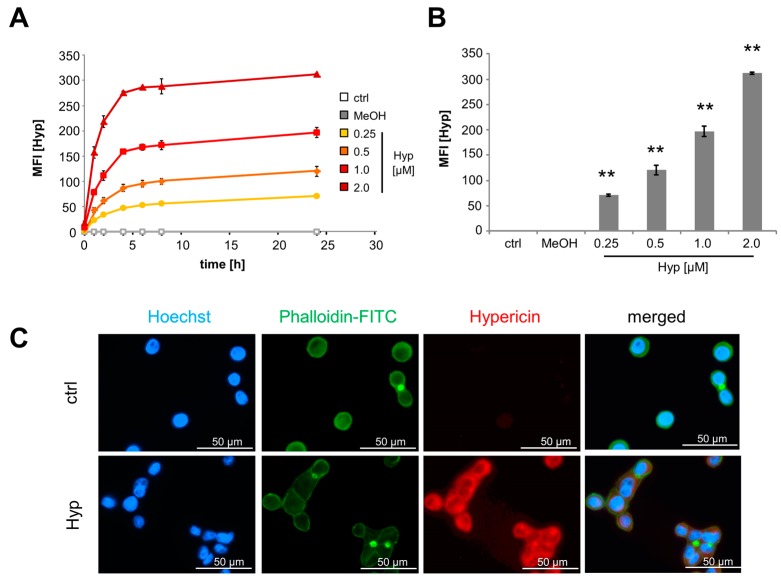
Figure 2.
Cellular hypericin uptake is dose and time dependent. (A) Kinetics of hypericin uptake in Jurkat cells measured by flow cytometry and (B) summarized after 24 h. Shown are the mean values ± standard deviations of quadruplicates of one representative experiment (Student’s t-test * p < 0.05; ** p < 0.01, treated cells versus control cells). (C) Fluorescence microscopy of HT-29 cells after incubation for 24 h with 2 μM hypericin (red); cellular nuclei and cytoskeleton were stained with Hoechst33342 (blue) and phalloidin-FITC (green). The scale bars represent 50 µm.

