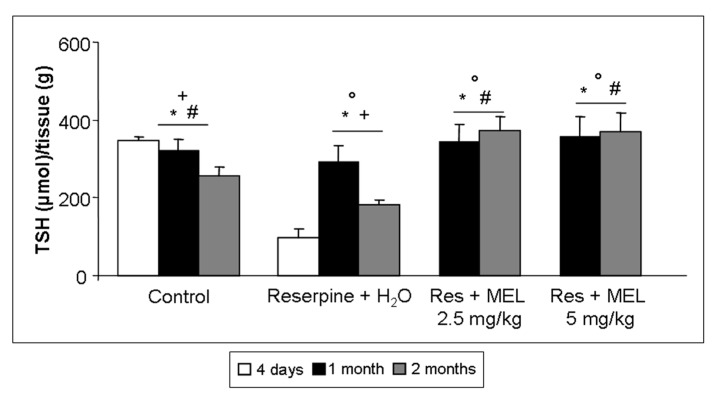
Figure 4.
Total thiols. The graph summarizes the gastrocnemius total thiol levels of all experimental groups, expressed as µmol/grams. ANOVA, two-way analysis of variance; * p ≤ 0.05 vs. Reserpine four days; # p ≤ 0.05 vs. Reserpine plus tap water; + p ≤ 0.05 vs. Reserpine plus melatonin 5 mg/kg/day for 2 months and ° p ≤ 0.05 vs. Controls. H2O: tap water; MEL: melatonin; Res: reserpine; TSH: total thiol.

