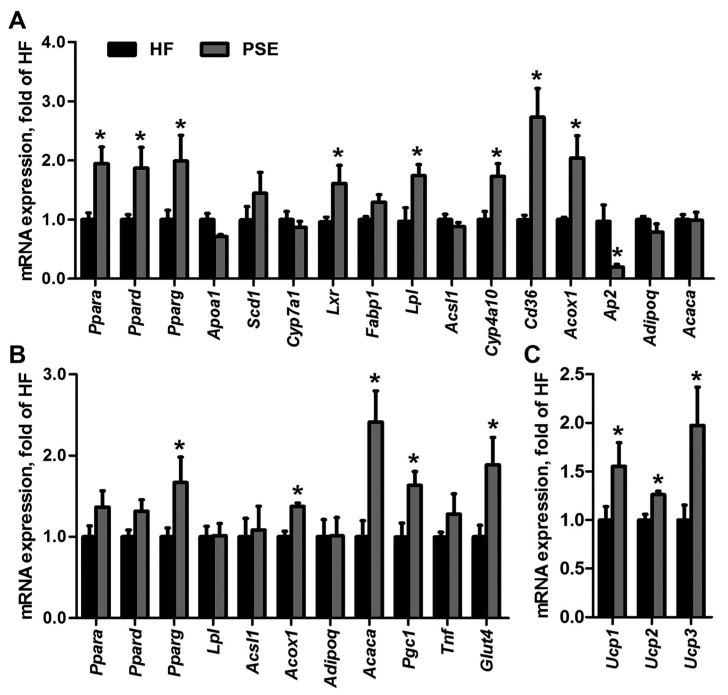
Figure 6.
Alterations of mRNA expression levels of PPARs and their target genes in: liver (A); WAT (B); and BAT (C) of 16-week HF diet-induced obese C57BL/6 mice after treatment with PSE for two weeks. For each group, equal amounts of total RNA from the tissues of 6 mice were subjected to qRT-PCR as described in the Methods. β-Actin was used as the internal control. The data are presented as means ± SEMs from three independent experiments. Statistical analyses were performed by Student’s t test. * p < 0.05 versus HF. Acaca, acetyl-Coenzyme A carboxylase α; Acox1, acyl-Coenzyme A oxidase 1; Acsl1, acyl-CoA synthetase long-chain family member 1; Adipoq, adiponectin; Ap2, fatty acid binding protein 4; Apoa1, apolipoprotein A-I; Cd36, cluster of differentiation 36; Cyp, cytochrome P450; Fabp1, fatty acid binding protein 1; Glut4, glucose transporter type 4; Lpl, lipoprotein lipase; Lxr, liver X receptor α; Pgc1, PPAR gamma coactivator 1 α; Ppar, peroxisome proliferator activated receptor; Scd1, stearoyl-Coenzyme A desaturase 1; Tnf, tumor necrosis factor α; Ucp, uncoupling protein.

