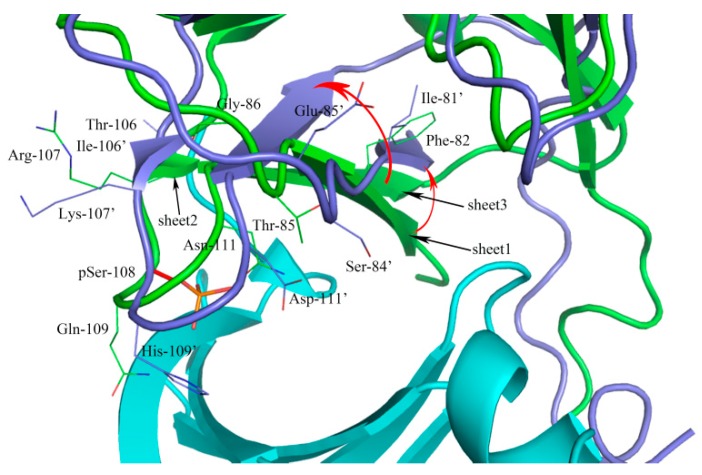
Figure 3.
Structural comparison of the scope within 5 Å of the active site from β1 and β2 subunits. The α subunit was shown in cartoon and colored by the cyan. The β1 and β2 subunits were shown in cartoon and colored by green and blue, respectively. The sites with different amino acids were shown in line. The Ser-108 was shown in stick and colored by red.

