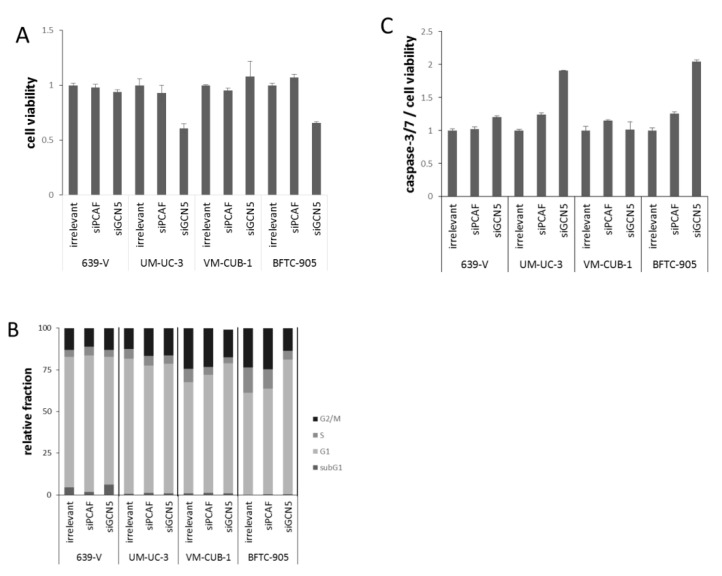
Figure 4.
Cellular effects of single GNAT knockdown. (A) Cell viability 72 h after GCN5 or PCAF knockdown in UCCs as measured by CellTiter-Glo assay (measuring total ATP). For each cell line, values were set as 1 for the treatment with irrelevant siRNA; (B) Cell cycle distribution after GCN5 or PCAF knockdown in UCCs as measured by flow cytometry (mean of triplicate values). The amount of apoptotic cells is reflected as subG1 fraction. Note an increased G2/M fraction in UM-UC-3, a slight increase in the G1 fraction in VM-CUB-1 and a more profound G1 arrest in BFTC-905 cells treated with siGCN5; (C) Caspase 3/7 activity after GCN5 or PCAF knockdown in UCCs. Values obtained by the Caspase-Glo assay were normalized to viability of each condition. For each cell line, values were set as 1 for the treatment with irrelevant siRNA.

