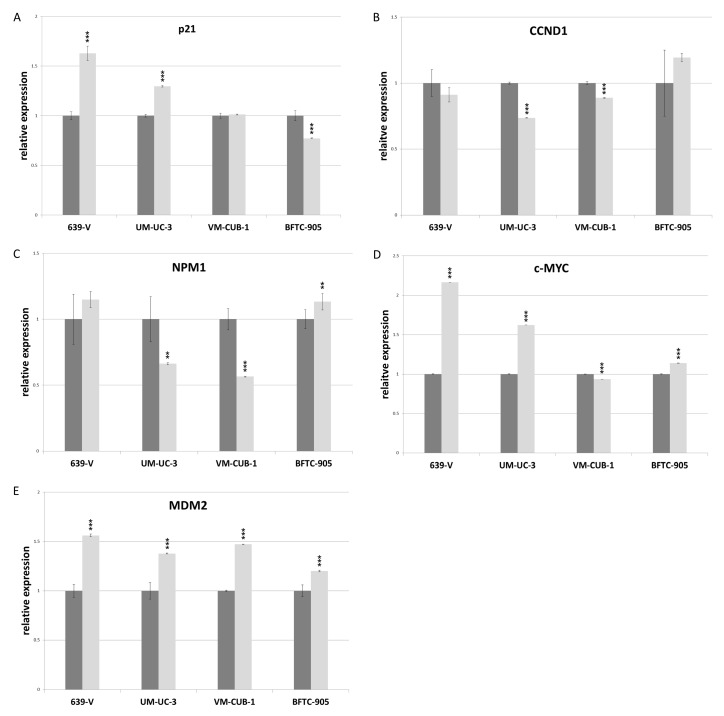
Figure 8.
RNA levels of p21 (A), CCND1 (B), NPM1 (C), c-MYC (D) and MDM2 (E) after double knockdown of GCN5 and PCAF in 639-V, UM-UC-3, VM-CUB-1 and BFTC-905 (from left to right). All values were determined by qRT-PCR, adjusted to TBP mRNA as a reference. Dark bars: irrelevant siRNA (values set as 1 for each cell line); light bars: GCN5 + PCAF siRNA. Asterisks denote significant differences, ** p < 0.01, *** p < 0.001.

