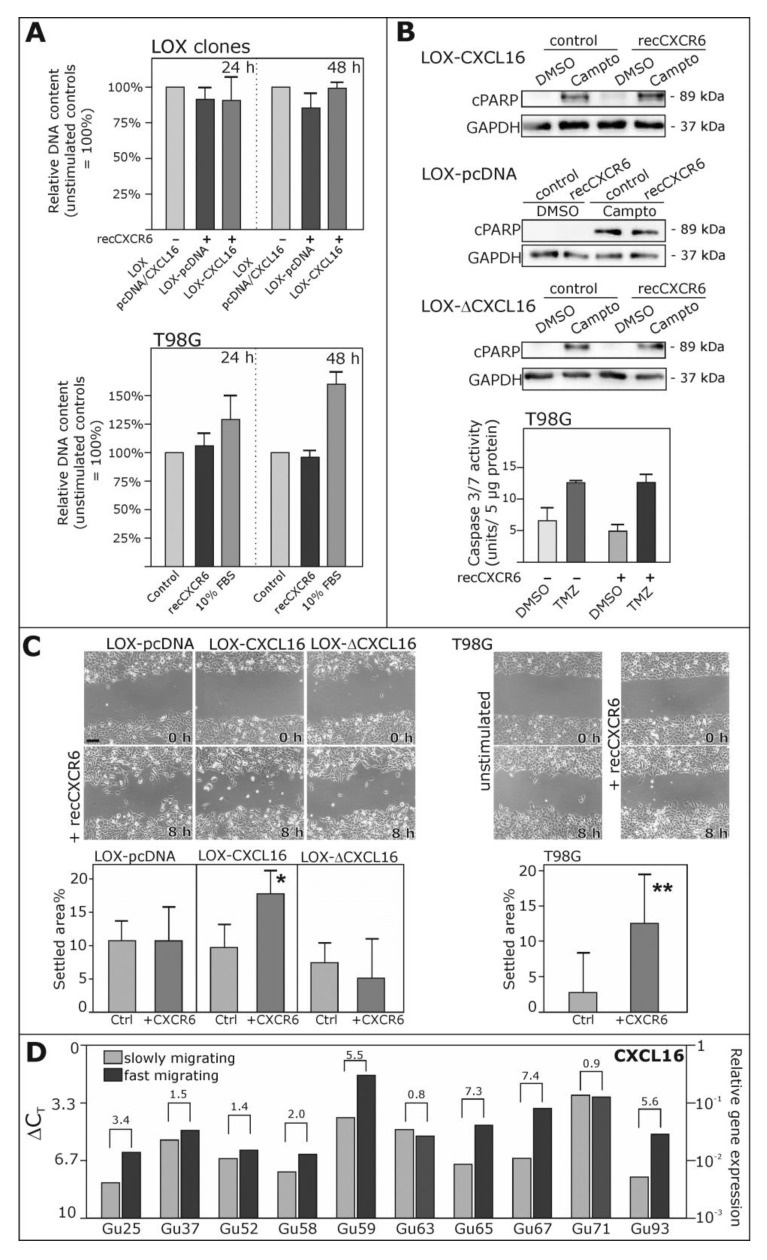
Figure 4.
Biological effects of reverse signaling via the CXCR6-CXCL16-axis. (A) To investigate effects on proliferation, DNA contents were measured in LOX-CXCL16 and as a control in LOX-pcDNA cells stimulated (or not) with 50 ng/mL recombinant (rec) CXCR6 for 24 or 48 h (upper part). Corresponding experiments were also performed with T98G glioblastoma cells (lower part); 10% fetal bovine serum (FBS) served as the positive control for proliferation. Unstimulated controls were set to 100%, respectively, and stimulation with CXCR6 did not yield any significant induction or reduction of DNA content. Mean ± SD from n = 3 independent experiments; (B) apoptosis was induced with 0.1 µg/mL camptothecin (Campto), in comparison to equal volumes of solvent control dimethylsulfoxide (DMSO) for 18 h in LOX-CXCL16, LOX-pcDNA and LOX-ΔCXCL16 cells or for 48 h in T98G glioblastoma cells, and simultaneous stimulation with 50 ng/mL recCXCR6 did not reduce cleavage of PARP (cPARP) as detected by Western blot or caspase 3/7 activity as determined by fluorimetric measurement of substrate cleavage, both indicating apoptosis. For Western blotting, equal loading was ensured by reprobing of the membrane with a glyceraldehyde 3-phosphate dehydrogenase (GAPDH)-specific antibody. Examples (Western blot) or mean values (caspase activity) of n = 3 independent experiments; (C) to investigate migration, scratch assays were performed with LOX clones LOX-CXCL16, LOX-pcDNA and LOX-ΔCXCL16 or T98G glioblastoma cells stimulated with 50 ng/mL recCXCR6 or left unstimulated for controls. Scratch areas were measured at the beginning and after 8 h, and settled areas were determined as the percentage of the initial scratch area. Stimulation with 50 ng/mL CXCR6 promotes migration of LOX-CXCL16 and T98G cells, but not LOX-pcDNA or LOX-ΔCXCL16 cells. Mean ± SD from n = 4 independent experiments; exemplary images are shown with equal magnifications, respectively; scale bar indicates 50 µm; * p < 0.05, ** p < 0.01; (D) fast migrating glioblastoma cells from freshly-dissected glioblastomas mostly show higher CXCL16 mRNA expression levels than the slowly migrating cells of the same tumor preparation. ΔCT levels are shown in a logarithmic scale (a 3.33 higher ΔCT value indicates a 10-fold lower mRNA expression), and numbers above the brackets indicate the (linearized) x-fold expression difference between fast and slowly-migrating cells of ten different primary and secondary glioblastoma samples.

