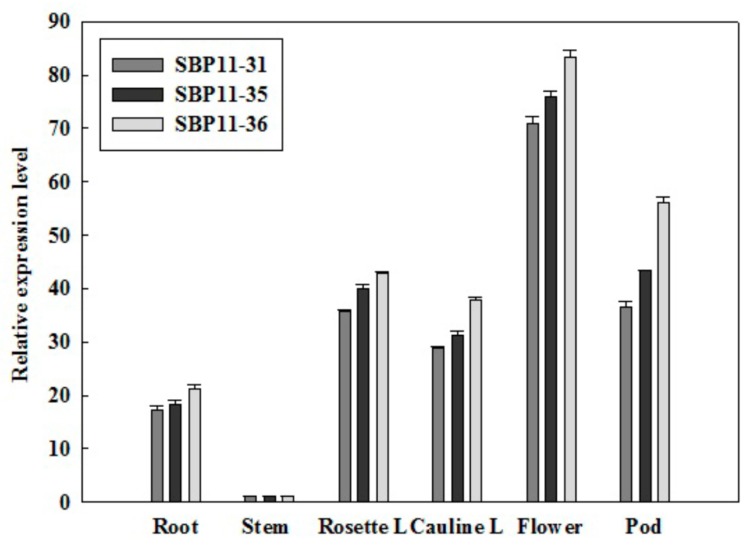
Figure 6.
Spatial expression pattern of VpSBP11. The relative expression levels of VpSBP11 were measured in different organs of WT and three transgenic lines (SBP11-31, SBP11-35, and SBP11-36): Root, Stem, Rosette Leaf (Rosette L), Cauline Leaf (Cauline L), Flower, and Pod. Expression in the stem was the lowest and was selected as the base value of comparison. AtActin1 was used as an internal control for qRT-PCR. Mean values and SDs were obtained from three biological experiments with consistent results.

