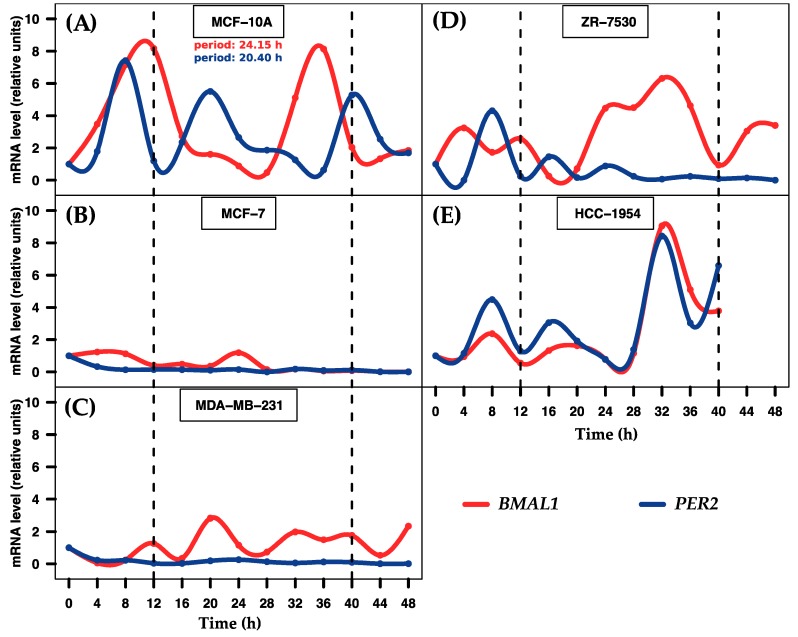
Figure 1.
Temporal expression of BMAL1 and PER2 genes in five breast cell lines. The graph depicts the level of expression of two clock genes at 4 h intervals over 48 h after 2 h serum shock entrainment. (A) MCF-10A cells show rhythmic profiles of both genes; (B–E) MCF-7, MDA-MB-231, ZR-7530 and HCC-1954 cells do not show rhythmic profiles. Dashed black lines at 12 and 40 h were added to show the period during which the profiles exhibited robustness. Data points (means of two biological replicates) were normalized using GAPDH relative to the first time point (t = 0) within each corresponding cell line.

