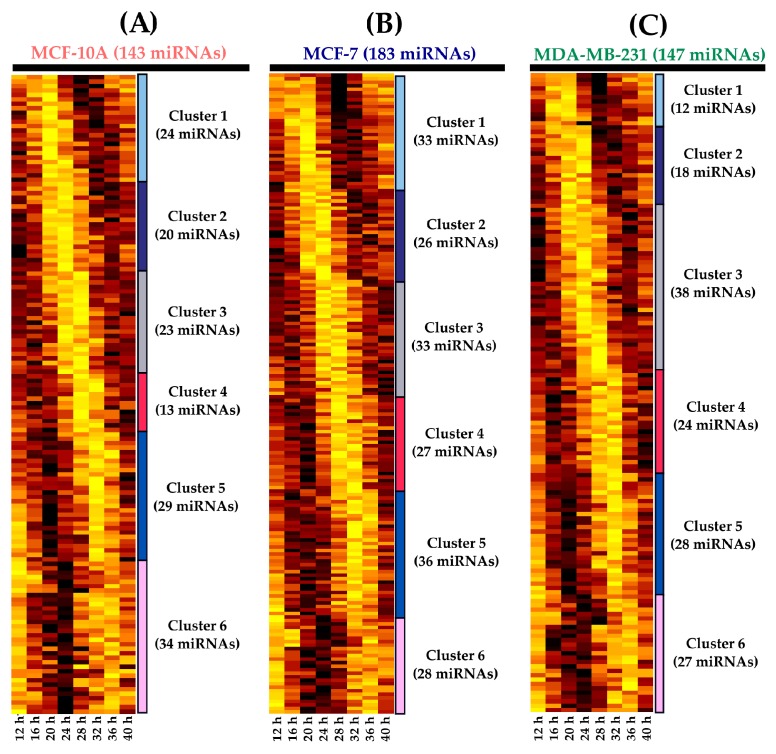
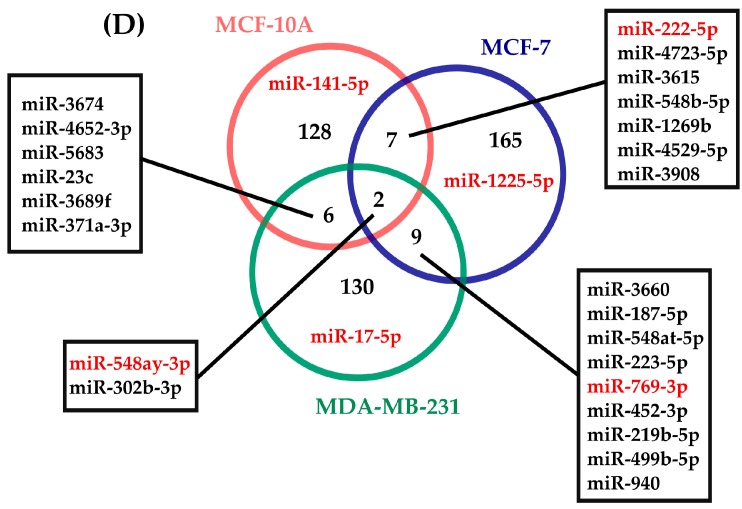
Figure 2.
Rhythmic expression of miRNAs identified in three breast cell lines. The heat maps depict the expression level of miRNAs over 28 h (hours 12–40 of the 48 h study) in (A) MCF-10A; (B) MCF-7; and (C) MDA-MB-231 cells. In addition, the heat maps show 6 different clusters of miRNAs that depict marked phases. Brown colors represent higher expression values, while yellow colors represent lower expression values. Expression values are z-scaled relative to each cell line; (D) Venn diagram of 143, 183, and 147 miRNAs that were rhythmically expressed over 28 h in MCF-10A, MCF-7, and MDA-MB-231. The diagram also shows miRNAs that exhibited rhythmicity across cell lines and were selected for RT-qPCR validation (red).


