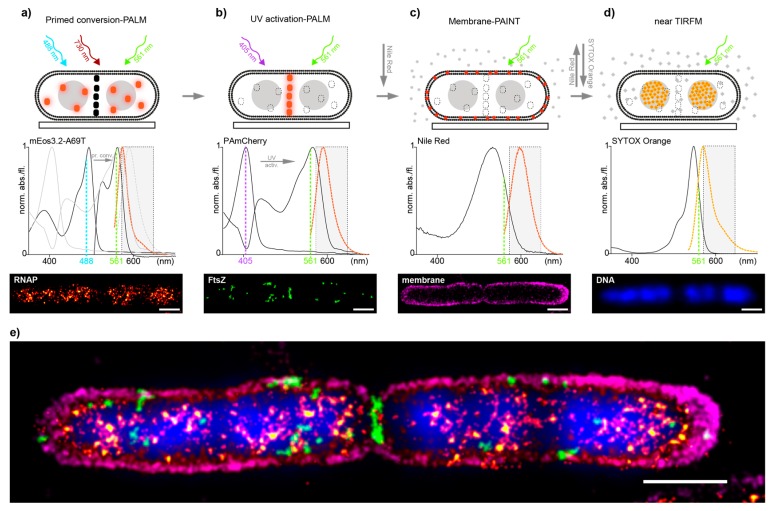
Figure 1.
(a–d) Multi-color imaging workflow in E. coli cells. Top: scheme representing the acquisition sequence by first imaging RNAP-mEos3.2-A69T (orange dots) by primed conversion-PALM, not activated FtsZ-PAmCherry molecules are depicted as black dots (a); FtsZ-PAmCherry (orange dots) by UV activation-PALM, permanently bleached RNAP-mEos3.2-A69T are presented as dashed-lined white dots (b); The outer membrane by PAINT using NileRed- red dots depict fluorescent fraction of NileRed molecules in the membrane, whereas gray dots represent non-fluorescent NileRed in buffer/medium (c) and last the DNA stained by SYTOX Orange (orange diamonds) and read-out by near TIRF microscopy (d). Middle: Measured absorption and emission spectra of all four fluorophores used (Supplementary Material and Methods). Dashed line rectangle represents the optical bandpass-filter used to visualize the fluorescence channel of all four acquisitions. Bottom: SMLM image reconstructions (a–c) and nearTIRF-snapshot (d) recorded; (e) Overlay of all individual images to show the mutual organization of imaged compounds, aligned by fiducial markers (Supplementary Material and Methods). Localization precision of the channels after drift correction (whole ROI, NeNA values): mEos3.2-A69T (RNAP) 12.1 nm, PamCherry (FtsZ) 12.3 nm, NileRed (membrane) 11.8 nm, scale bars: 1 μm.

