Figure 3.
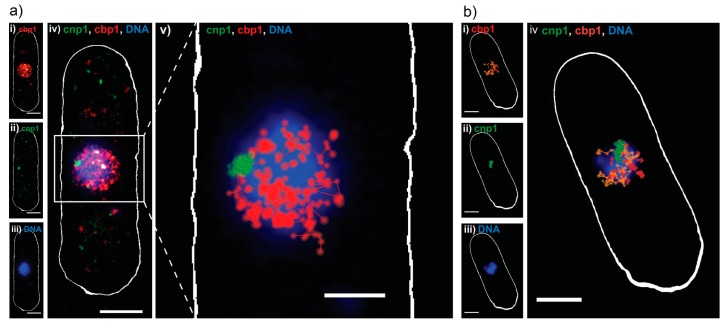
Sequential dual-color PALM on S. pombe. (a) Dual-color PALM image of a representative S. pombe cell, expressing the DNA binding protein cbp1 tagged with Dendra2 (red) and the centromeric protein cnp1 tagged with PAmCherry (green) and a widefield fluorescence image of DAPI stained DNA (blue): (i–iii) Split channels of the same cell and (iv) combined; (v) single particle track analysis performed on the same data, with tracks ≥3 consecutive frames represented in red (cbp1) and green (cnp1), on top of DNA (blue). Scale bars 2 μm; (b) single particle tracking analysis done on a different S. pombe cell: (i) single particle tracks of cbp1 ≥4 consecutive frames, color coded for their apparent diffusion coefficient D as calculated from a MSD analysis of the individual tracks, orange for fast moving particles (D > 0.26 μm2/s) and red for slow or immobile (D < 0.26 μm2/s); (ii) single particle tracks of cnp1 ≥ 4 consecutive frames; (iii) widefield fluorescence image of DNA in the same cell, after fixation; (iv) overlay of all three channels. Scale bars 2 μm.

