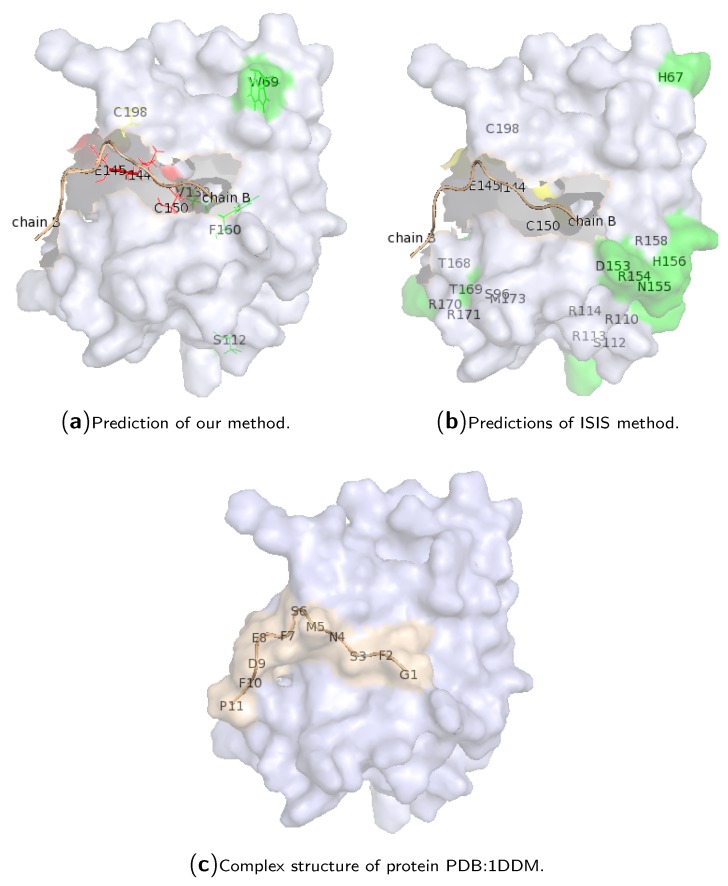
Figure 3.
Case study for the complex of protein PDB:1DDM. The subgraphs (a,b) are shown for the prediction comparison of our method and the ISIS method, respectively, where the chain B of protein 1DDM is colored in wheat. The subgraph (c) illustrates the cartoon structure of the protein complex, where the chain B of protein 1DDM is colored in green. Here, red residues are the hotspots that are predicted correctly; green residues are non-hotspots that are predicted to be hotspots; while yellow ones are real hotspots that are predicted to be non-hotspot residues. All other residues are correctly predicted as non-hotspots.

