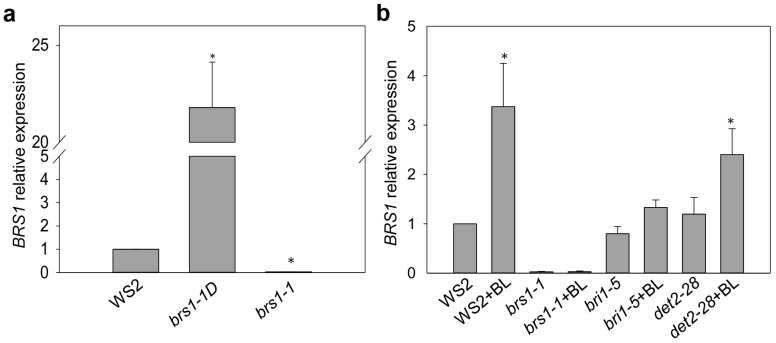
Figure 5.
Relative BRS1 transcript levels in root tissue. (a) BRS1 transcript level in mutants; (b) BRS1 transcript level in response to BL treatment. BRS1 transcript levels were measured by qRT-PCR after 24-epi-brassinolide treatment. The data is shown for two independent biological replicates and three technical replicates ± SE. The asterisks indicate a significant difference from the corresponding control experiment by Student’s t-test (* p < 0.05).

