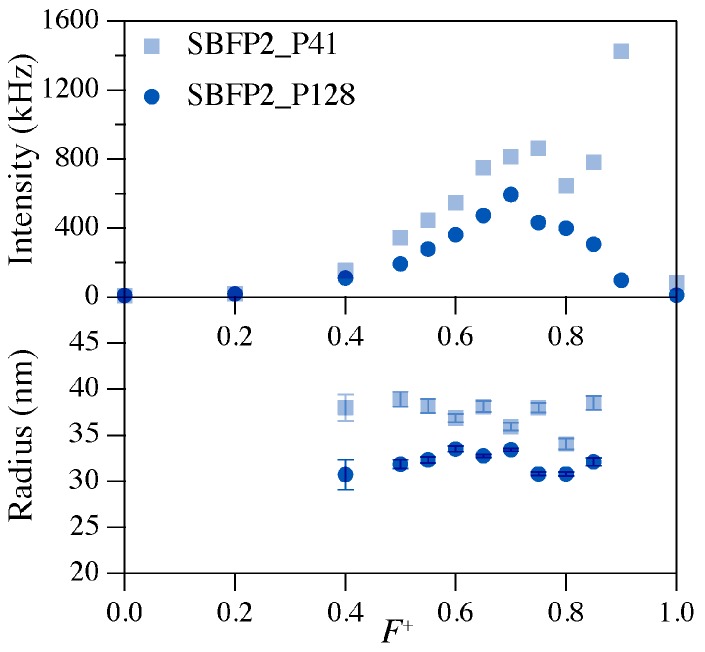
Figure 3.
DLS results of micellar compositions of SBFP2 mixed with P2MVP41-b-PEO205 (P41, light blue colored blocks) or P2MVP128-b-PEO477 (P128, dark blue colored circles). The protein concentration was kept constant at 1.0 μM. Top graph shows scattered intensity as a function of the F+ composition, and bottom graph shows the hydrodynamic radius as a function of the F+ composition. Error bars reflect the distribution of radii in one experiment. DLS composition results of the six other fluorescent proteins are given in Figure S2.

