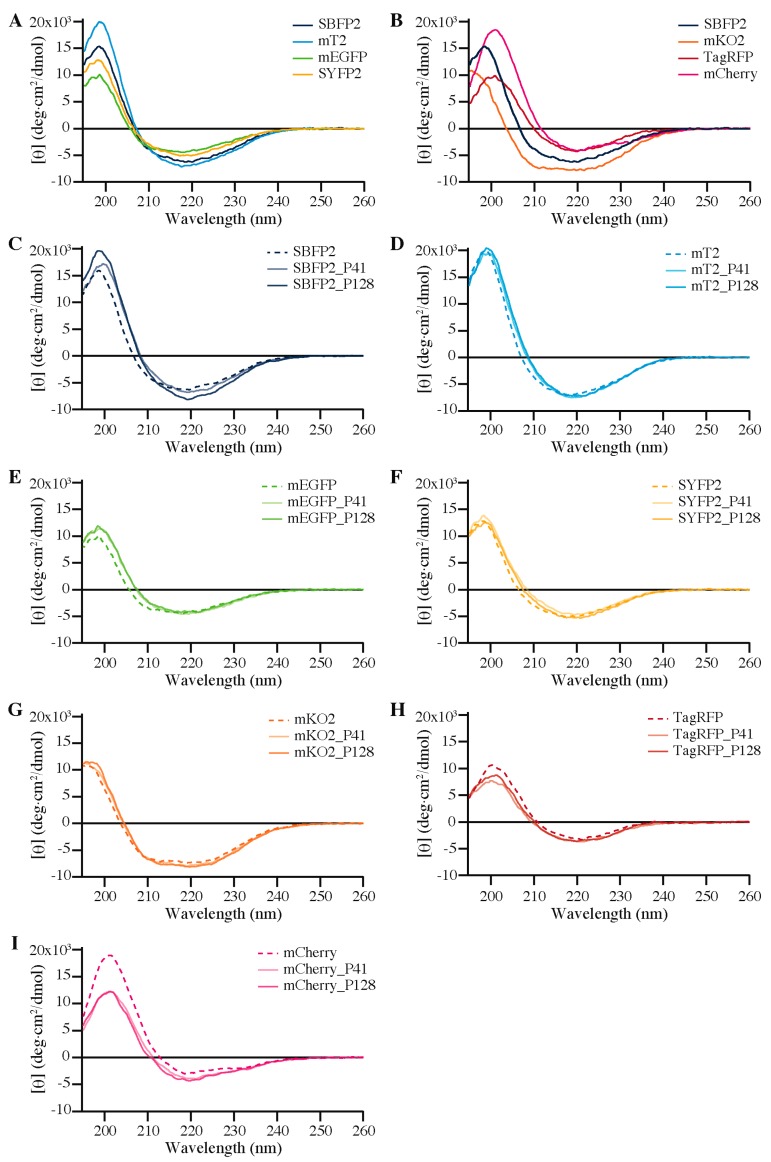
Figure 6.
Comparison of the far-UV CD spectra of the free proteins (A) avFPs; (B) anFPs with SBFP2 as a reference representing the avFPs. Far-UV CD spectra of (C) SBFP2; (D) mTurquoise2 (mT2); (E) mEGFP; (F) SYFP2; (G) mKO2; (H) TagRFP and (I) mCherry free in solution (dashed line) and encapsulated with P2MVP41-b-PEO205 (P41, solid light colored line) and P2MVP128-b-PEO477 (P128, solid dark colored line). The corresponding high tension signals are shown in Figure S6.

