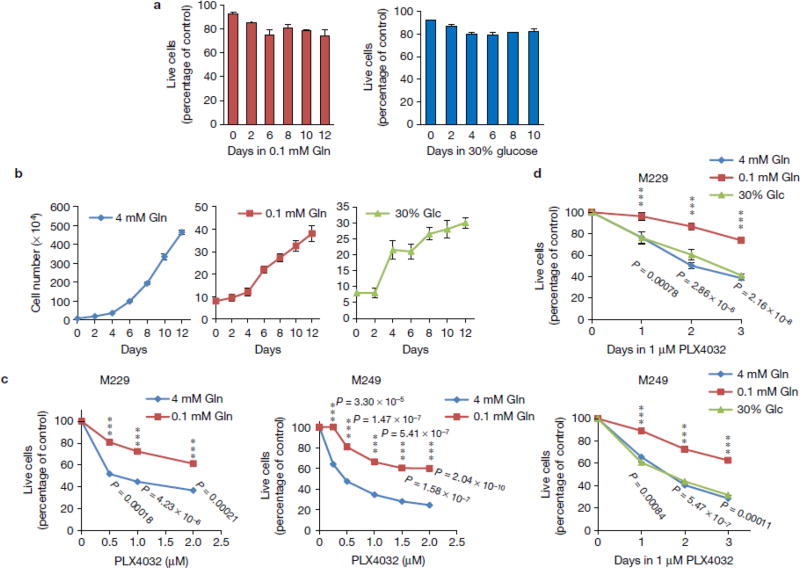
Figure 5. Low glutamine-induced de-differentiation results in resistance to BRAF inhibitor treatment.
(a) M229 cells were cultured in the medium with 0.1mM glutamine or 30% (7.5mM) glucose for different days as indicated. Cell viability was assessed by Propidium Iodide exclusion. Data represent mean ± S.D., n=3 independent experiments. (b) M229 cells were cultured in complete, 0.1mM glutamine or 30% glucose (7.5mM) medium for different days as indicated. Cell number was counted every two days. Data represent mean ± S.D., n=4 independent experiments. (c) M229 and M249 cells were cultured in complete or 0.1mM glutamine medium for 4 days, and then treated with different doses of PLX4032 for 72 hours. MTS assay was performed to measure cell viability. Data represent mean ± S.D., n=3 independent cell culture for M229; n=4 for M249. ***P<.001 by unpaired two-tailed Student’s t-test. (d) M229 and M249 cells were cultured in complete, 0.1mM glutamine, or 30% glucose (7.5mM) medium for 4 days, then treated with 1µM PLX4032 for 24, 48, or 72 hours. MTS assay was performed to measure cell viability. Data represent mean ± S.D., n=4 independent cell culture. ***P<.001 by unpaired two-tailed Student’s t-test. Source data are shown in supplementary Table 4.

