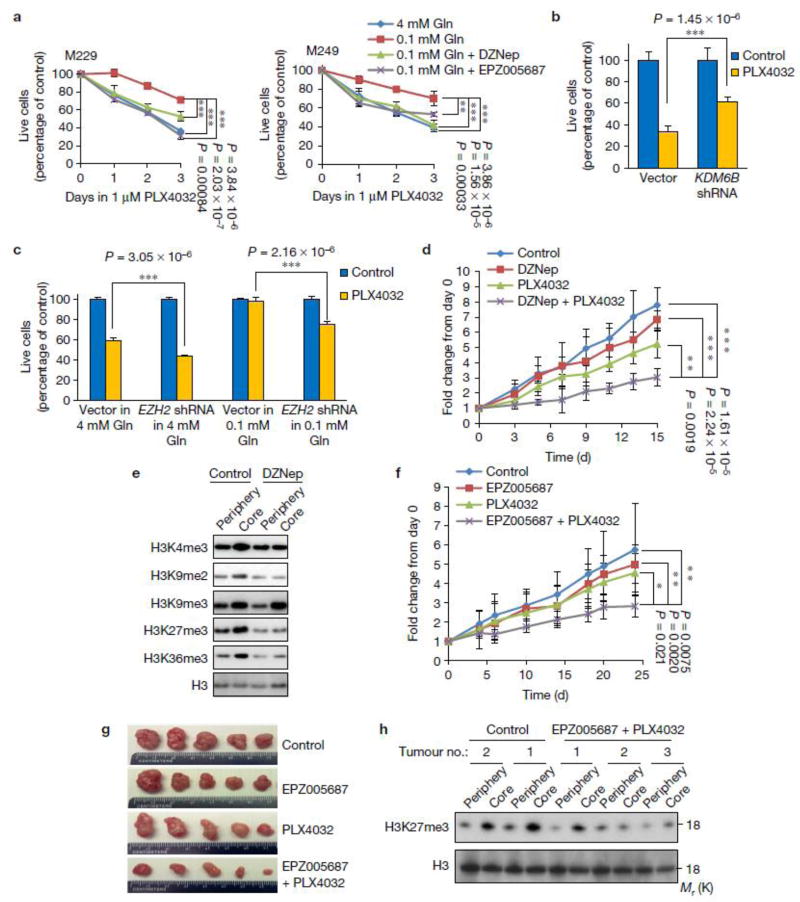
Figure 7. Low glutamine-induced drug resistance is mediated by histone methylation on H3K27.
(a) M229 or M249 cells were cultured in complete medium or 0.1mM glutamine medium with histone methylation inhibitors DZNep or EPZ005687 for 4 days, and then cells were treated with 1µM PLX4032 for 3 days. MTS assay was performed to measure viability. Data represent mean ± S.D., n=4 (M229), or n=6 (M249) independent cell culture. ***P<.001 by unpaired two-tailed Student’s t-test. (b) Control vector and KDM6B shRNA lenti viral transduced M229 bulk cells were treated with DMSO control or 1µM PLX4032 for 72 hours. MTS assay was performed to measure viability. Data represent mean ± S.D., n=6 independent cell culture. ***P<.001 by unpaired two-tailed Student’s t-test. (c) Control vector and EZH2 shRNA lenti viral transduced M229 bulk cells were treated with DMSO control or 1µM PLX4032 for 48 hours. MTS assay was performed after treatment. Data represent mean ± S.D., n=5 independent cell culture. ***P<.001 by unpaired two-tailed Student’s t-test. Source data for a, b and c are shown in supplementary Table 4. (d) NSG mice were injected subcutaneously with 5×10⁶ M229 cells. When the tumour size reached an average of 100mm3, mice were treated with vehicle control (n=6 mice), DZNep (I.P. injection 1.5mg/kg, n=4 mice), PLX4032 (Oral gavage, 10mg/kg, n=5 mice), or both DZNep and PLX4032 (n=5 mice) daily for 15 days. Tumour size was measured over time. Graph represents mean ± S.D., **P<.01, ***P<.001 by unpaired two-tailed Student’s t-test. (e) Samples from peripheral or core regions of the individual tumour as indicated were lysed and immunoblotting was performed with indicated antibodies. Total H3 was used as loading control. (f) Nude mice were injected subcutaneously with 5×10⁶ M229 cells. When the tumour size reached an average of 100mm3, mice were treated with vehicle control (n=8 mice), EPZ005687 (I.P. injection, 2.5mg/kg, n=7 mice), PLX4032 (Oral gavage, 10mg/kg, n=6 mice), or both DZNep and PLX4032 (n=7 mice) every other day for 25 days. Tumour size was measured over time. Graph represents mean ± S.D. *P<.05, **P<.01 by unpaired two-tailed Student’s t-test. (g) Representative tumours in each group. (h) Samples from peripheral or core regions of the individual tumour as indicated were lysed and immunoblotting was performed with indicated antibodies. Total H3 was used as loading control. Unprocessed original scans of blots are shown in Supplementary Fig. 8.

