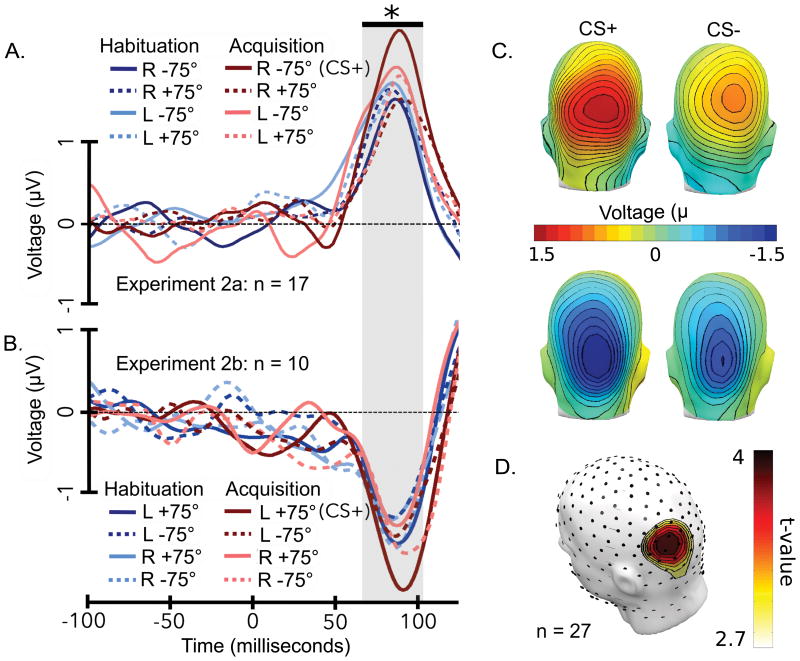
Figure 3.
C1 component. Grand mean ERPs are shown both as waveforms (sensor POz) and as topographies (mean across the rising slope of the C1 window, which is thought to reflect the afferent response to early visual cortex). For Experiment 2a, all lower visual field stimuli are shown (A) for acquisition and habituation, to compare the stimulus paired with a loud noise (CS+), against seven unpaired control conditions. (B) For Experiment 2b, all upper visual field stimuli are shown for acquisition and habituation. Note that opposite-field ERPs were also available in each experiment, but are not shown here. A black bar and grey box denote the time window during which the C1 elicited by the CS+ was significantly heightened (p < .05, permutation controlled test, to provide a more conservative test of significance) compared to control conditions. (C) To visualize the spatial distribution of the early C1 component, the mean across the time points highlighted by the grey box are shown as topographical distributions of voltage covering the scalp for Experiment 2a and Experiment 2b. (D) The topographical distribution of t-values that exceed the permutation controlled critical t-value is depicted for the rising slope of the C1 component.

