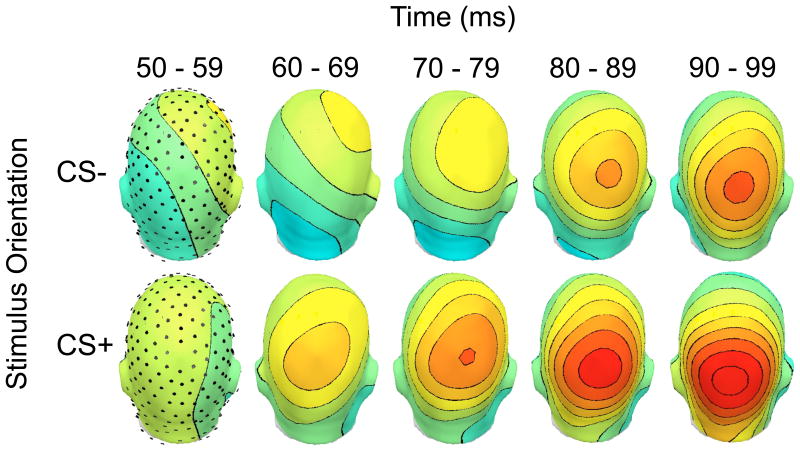
Figure 6.
Stability of the topographical distribution during the rising slope of the C1. To demonstrate the stability of the topography, a back view of the rising slope of the C1 component is shown for participants in Experiment 2a (n = 17), comparing the CS+ (lower visual field, right eye, -75°) to an example CS- (lower visual field, right eye, +75°). The CS+ elicited a larger C1 component than the CS-. Voltage topographies are shown for five 10 millisecond bins from 50-99 milliseconds post-stimulus. The color axis ranges from -2 (blue) to 2 (red) μV.

