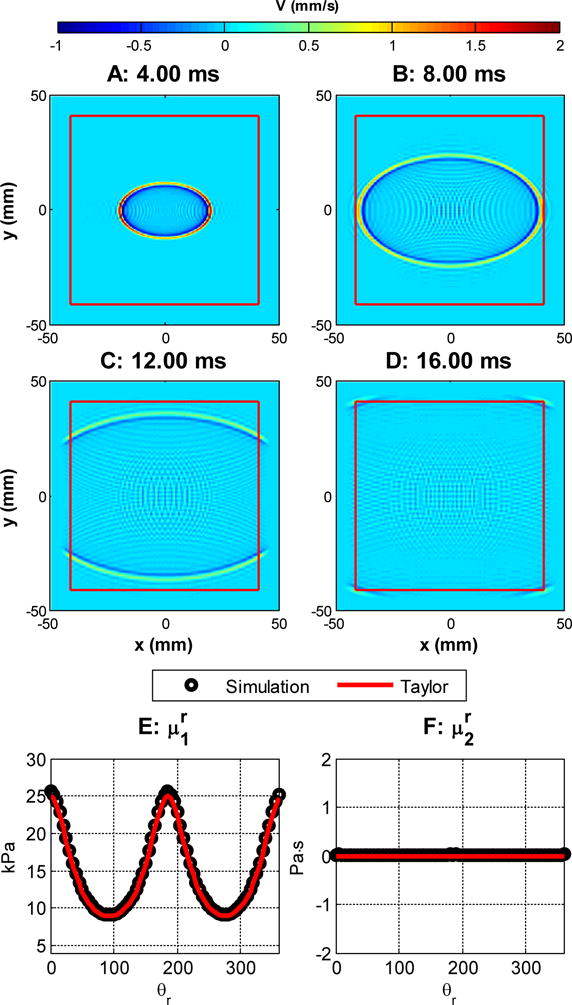
Figure 4.

Shear wave propagation. , , , . A–D: the waveform at 4, 8, 12 and 16 ms, respectively. The area enclosed by the red square does not have PML damping. E and F: group elasticity and viscosity estimated from simulation and its comparison with Equations 22 and 23.
