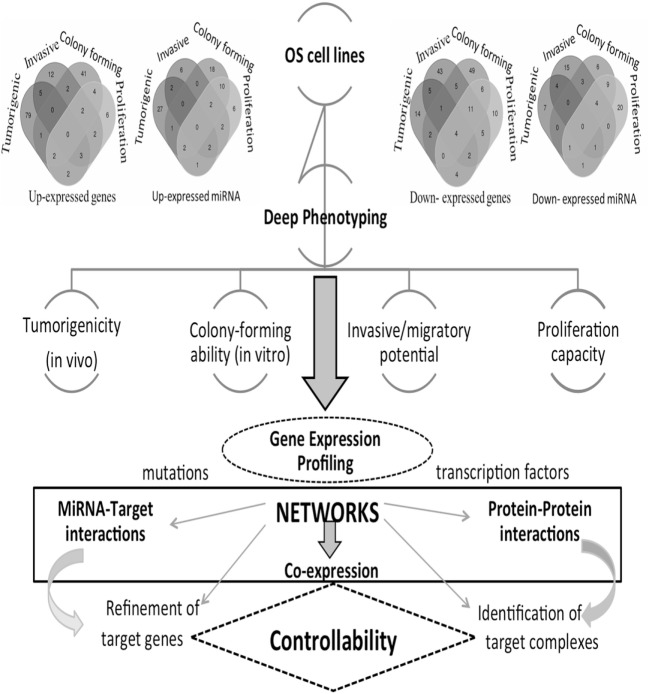
Figure 1.
Computational and analytical flowchart. Differentially expressed gene (DEG) profiles are reproduced from each osteosarcoma (OS) cell line and comprehensive comparative analyses are derived. Venn diagrams show DEGs and DE miRNAs for the different phenotypes here considered: tumorigenic, invasive, colony forming, and proliferation. Different types of networks are employed: gene co-expression, miRNA-target, and protein–protein interaction networks, including drugs. These are then functionally annotated, including pathways and protein complexes. Deciphering cancer regulation networks suggests the application of control concepts. These are hard to implement, but this challenge may be transformed into a sequence of tasks solved with the help of accurately selected fractions of nodes and corresponding links describing critical features. This goal corresponds to setting a target control problem, whose solution requires the search for a minimum number of driver nodes. In real cancer networks, it is natural to expect that only approximate solutions may hold. Through the identification of targets in cancer networks, we can establish the cancer relevance of functional controllability.

