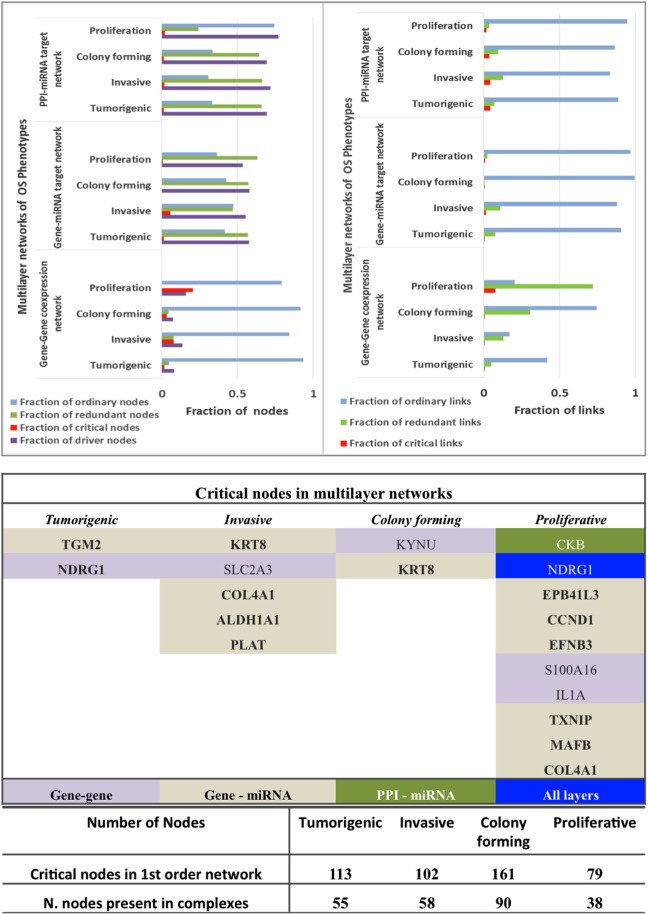
Figure 6.
Controllability analysis. Top panel: gene–gene co-expression networks, miRNA-gene target networks and protein–protein interaction (PPI)-miRNA interaction networks showing occurrence of critical, ordinary, and redundant nodes. Mid panel: Critical nodes in multi-layered networks mapped to first order networks. Bottom panel: critical nodes computed in PPI first order networks and number of critical nodes in protein complexes that are manually curated and experimentally validated in CORUM database. Further statistics on classification of nodes in various networks is provided in Figure 5.

