Figure 1.

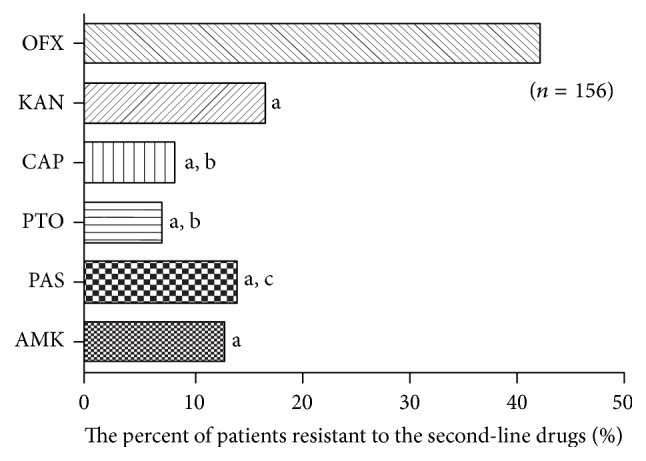
Distribution of MDR isolates resistant to different second-line drugs. aCompared with OFX group, P < 0.001. bCompared with KAN group, P < 0.05. cCompared with PTO group, P < 0.05.

Distribution of MDR isolates resistant to different second-line drugs. aCompared with OFX group, P < 0.001. bCompared with KAN group, P < 0.05. cCompared with PTO group, P < 0.05.