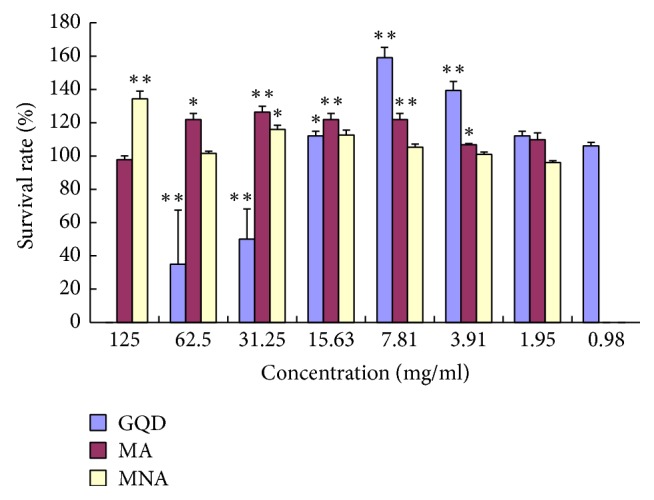
Figure 3.

Effects of GQD and its aggregates on proliferation of INS-1 pancreatic β-cells. n = 5. GQD (in blue): compared with normal controls, 0.98~1.95 mg/mL (P > 0.05), 15.63 mg/mL (0.01 < P < 0.05, “∗”), and others (P < 0.01, “∗∗”); MA (in orange): 400 g sediment, compared with normal controls, 125.0 mg/mL and 1.95 mg/mL (P > 0.05), 62.50 and 3.91 mg/mL (0.01 < P < 0.05, “∗”), and others (P < 0.01, “∗∗”); MNA (in grey): 15000 g sediment, compared with normal controls, 125.0 mg/mL (P < 0.01, “∗∗”), 31.25 mg/mL (0.01 < P < 0.05, “∗”), and others (P > 0.05). Error bars + SEM. Differences are significant according to a one-way ANOVA indicated with an asterisk (P < 0.05; n = 4) or double asterisks (P < 0.01; n = 4).
