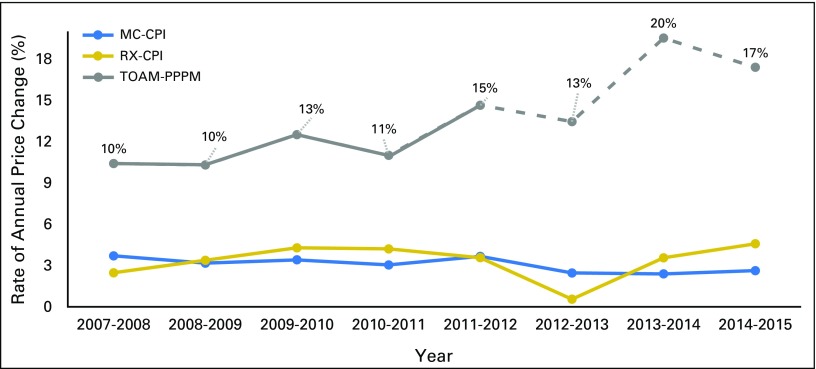
Fig 3.
Rate of annual price change, 2007 to 2015. Dashed gray line represents projection on the basis of data published by Centers for Medicare & Medicaid Services. CPI, Consumer Price Index; MC, medical care; OOP, out-of-pocket; PPPM, per patient per month; RX, prescription drug; TOAM, targeted oral anticancer medication.

