
Figure 4. Significant association between YAP1 and TAZ activation and prognosis and mTORC1 regulation in HCC.
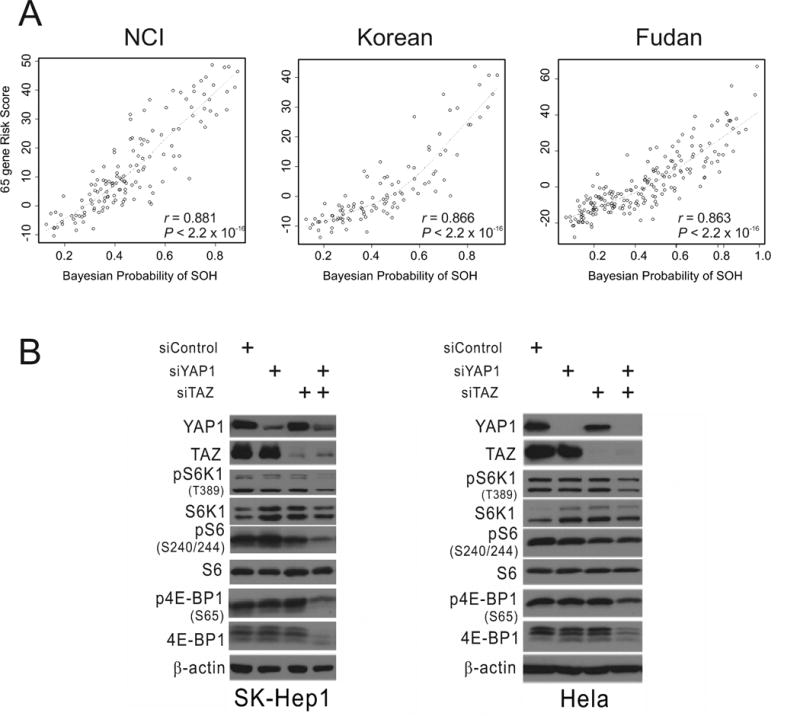
(A) Correlation between Bayesian probability of the silence of the Hippo signature and the 65-gene risk score in the National Cancer Institute (NCI), Korean, and Fudan University Liver Cancer Institute cohorts. Dotted curves represent locally weighted scatterplot smoothing curves.
(B) Western blot analyses of SK-Hep1 and HeLa cells with the indicated antibodies after silencing YAP1 and TAZ expression with specific siRNAs.