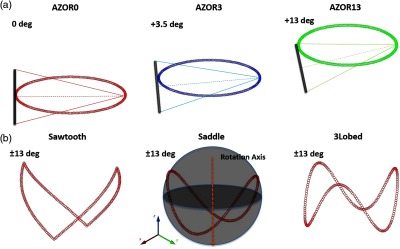
Fig. 2.

Plots depicting the six different acquisition trajectories utilized for the initial experiments; (a, L-R) Simple circular orbits AZOR0, AZOR3, AZOR13, and (b, L-R) complex acquisition orbits sawtooth, saddle, and 3Lobed. The complex orbits traverse the polar and azimuthal arcs on a sphere (depicted in the saddle plot), about the dotted rotation axis. A graphic representation of the x-ray cone beam and the FPD is also shown at top to better visualize the system tilts for the simple circular orbits.
