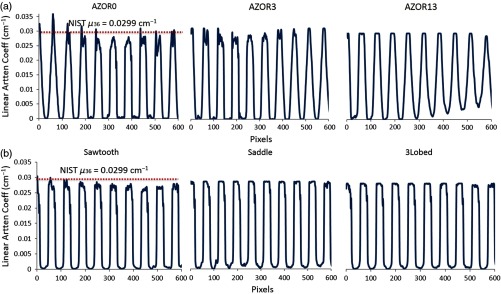
Fig. 9.
Profiles measured across the center of the reconstructed sagittal slices of the extended Defrise slabs, for the indicated acquisition trajectories. The OSC algorithm reconstructs data to raw attenuation coefficients; the dotted line represents the attenuation coefficient of acrylic (at 36 keV) obtained from NIST. Profiles indicate that the attenuation coefficients are more uniform and without intradisk blurring for the (a) complex orbits as compared with the (b) simple circular orbits.

