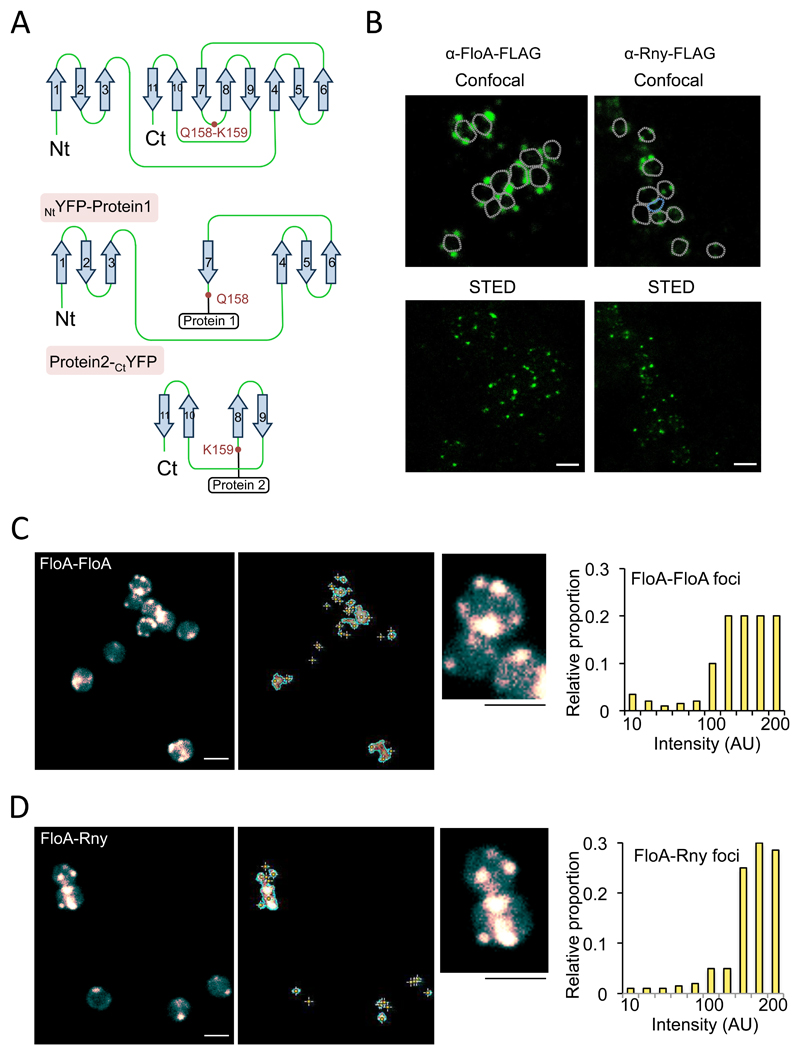
Figure 2. Construction of a split-YFP reassembly assay in S. aureus to test flotillin interactions.
(A) STED microscopy analyses of FloA and Rny subcellular localization. Fluorescence signal is represented in green. Upper row shows signal using confocal microscopy and bottom row show the same cells imaged by STED microscopy. Scale bar is 2 μm. (B) Tertiary structure of a codon-improved YFP suitable for gram-positive bacteria. Dissection of YFP at a surface loop between residues Q158 and K159 generated NtYFP and CtYFP fragments. Below are the NtYFP and CtYFP fragments generated by dissection. (C) Fluorescence microscopy analyses of split-YFP reassembly in control FloA-FloA interaction after incubation (37°C, 72 h, 200 rpm agitation). Center panel shows signal detection. Right panel shows semi-quantitative determination of the fluorescence signal. Scale bar is 2 μm. (D) Fluorescence microscopy analyses of split-YFP reassembly in FloA-Rny interaction (37°C, 72 h, 200 rpm agitation). Center panels shows signal detection and detail of subcellular localization of fluorescence foci. Right panel shows semi-quantitative determination of signal. To quantify fluorescence signal, we counted 700 random cells from each of three microscopic fields for each strain (n = 2100 cells in total for each strain). Scale bar is 2 μm.

